
Creating a Scatter Plot: DP1B-04-P3-Q3 Interactive Exercise
Loading the math board and drawing, please wait…
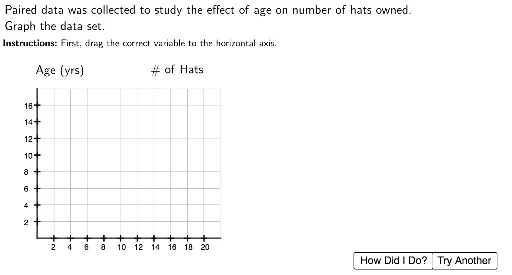
This GeoGebra example demonstrates how to create a scatter plot by generating random points on a coordinate plane, with an interactive interface for students to determine whether points lie within specified regions. Core mathematical concepts include coordinate geometry, point location, integer coordinates, and random data generation. The construction uses GeoGebra commands such as Random, Sequence, Point to generate random points, Append and Sort to manage point lists, Segment and Polygon to define region boundaries, and Shuffle and Element to randomize answer options. Additional objects like RotateText, PointLocation, TryAnother, and CheckMark provide interactive feedback. Suitable for middle and high school students (e.g., IB DP Mathematics) learning statistical plotting and coordinate geometry in classroom or self-study settings.
GeoGebra Commands & Parameters
Append(Sequence[Sequence[(1 + j, 1 + i), i, 0, 8], j, 0, 10], PointLocation) → GridSpaceLaTeX("Which\ variable\ should\ be\ on\ which\ axis?") → InstructionsSegment(Origin, (x(Origin), yHeight)) → yaxisSegment(Origin, (xHeight, y(Origin))) → xaxisLaTeX("Time") → Item1LaTeX("Money") → Item2Polygon(Pt1, Pt1 + Corner[Item1, 3] - Corner[Item1, 4], Pt1 + Corner[Item1, 2] - Corner[Item1, 4], Pt1 + Corner[Item1, 1] - Corner[Item1, 4]) → DragSpace1, pt1, f, g, hPolygon(Pt2, Pt2 + Corner[Item2, 3] - Corner[Item2, 4], Pt2 + Corner[Item2, 2] - Corner[Item2, 4], Pt2 + Corner[Item2, 1] - Corner[Item2, 4]) → DragSpace2, pt2, i, j, kLaTeX("\checkmark") → CheckMarkLaTeX("\times") → WrongPolygon(Origin, (xHeight, y(Origin)), (xHeight, -10), (x(Origin), -10)) → WhiteSpace1, origin, l, m, nPolygon((x(Origin), yHeight), (xHeight, yHeight), (xHeight, 30), (x(Origin), 30)) → WhiteSpace2, p, q, r, sPolygon((x(Origin), -10), (x(Origin), 30), (-10, 30), (-10, -10)) → WhiteSpace3, t, a, b, cPolygon((xHeight, -10), (xHeight, 30), (30, 30), (30, -10)) → WhiteSpace4, d, e, f_1, g_1Shuffle({Item1lc, Item2lc}) → ItemListElement(ItemList, 1) → FirstItemElement(ItemList, 2) → SecondItemLaTeX("Paired\ data\ was\ collected\ to\ study\ the\ relationship\ between\ " + FirstItem + (("\\ and\ " * SecondItem)) + ". \, Which\ one\ would\ you\ place\ on\ the\ horizontal\ axis?") → InstructionsQ1LaTeX(("The\ independent\ variable\ affects\ the\\ dependent\ variable.\\ It\ is\ likely\ that\ " * Item1lc) + "\\ affects\ " + Item2lc + "\ so\ we\\ identify\ " + Item1lc + "\ as\ the\\ independent\ variable\ and\ place\ it\\ on\ the\ horizontal\ axis.") → FeedbackQ1LaTeX("Drag\ a\ variable\ onto\ the\ horizontal\ axis\\ before\ checking\ your\ work.") → FeedbackNotStartedSequence((1 + i, 1), i, 1, 10) → XPointLocationsSequence((1, 1 + i), i, 1, 8) → YPointLocationsSequence(Text[(ymult * i), Element[YPointLocations, i] - (0.79, 0.2)], i, 1, 9) → YLabelsSequence(Text[(xmult * i), Element[XPointLocations, i] - (0.18, 0.7)], i, 1, 10) → XLabelsRotateText(LaTeX[Item2], π / 2) → YLabelLaTeX(Item1) → XLabelPoint(GridSpace) → Point1Point(GridSpace) → Point2Point(GridSpace) → Point3Point(GridSpace) → Point4Point(GridSpace) → Point6Point(GridSpace) → Point5Sort({Point1, Point2, Point3, Point4, Point5, Point6}) → PointsSort({(x1 / xmult, y1 / ymult), (x2 / xmult, y2 / ymult), (x3 / xmult, y3 / ymult), (x4 / xmult, y4 / ymult), (x5 / xmult, y5 / ymult), (x6 / xmult, y6 / ymult)} + {(1, 1), (1, 1), (1, 1), (1, 1), (1, 1), (1, 1)}) → AnswerSequence(TLPoint - (0, (i * Height)), i, 1, 7) → LeftPtsSequence(TRPoint - (0, (i * Height)), i, 1, 7) → RightPtsSegment(TMPoint, BMPoint) → h_1Segment(TLPoint, Element[LeftPts, 7]) → LeftSegmentSegment(TRPoint, Element[RightPts, 7]) → RightSegmentSequence(Segment[Element[LeftPts, i], Element[RightPts, i]], i, 1, 7) → SegmentsSegment(TLPoint, TRPoint) → TopLineElement(LeftPts, 1) → PtAElement(RightPts, 1) → PtBPolygon(TLPoint, PtA, PtB, TRPoint) → q1, tlpoint, pta, ptb, trpointLaTeX("Points\text{:}") → PointTextLaTeX(x1) → x1TextLaTeX(x2) → x2TextLaTeX(x3) → x3TextLaTeX(x4) → x4TextLaTeX(x5) → x5TextLaTeX(x6) → x6TextLaTeX(y1) → y1TextLaTeX(y2) → y2TextLaTeX(y3) → y3TextLaTeX(y4) → y4TextLaTeX(y5) → y5TextLaTeX(y6) → y6TextLaTeX(Item1) → XColLabelLaTeX(Item2) → YColLabelRandom(1, 5) → qindexLaTeX("The\ correct\ answer\ is\ shown.\, See\ where\ you\\ made\ mistakes\ and\ try\ again.") → FBAnsShownLaTeX("Drag\ all\ the\ points\ onto\ the\ grid\ before\\ checking\ your\ work.") → FBNotStarted2LaTeX("Correct!") → FBCorrectLaTeX("One\ or\ more\ of\ the\ points\ is\ incorrect.\,\\Please\ try\ again.") → FBWrongLaTeX("Paired\ data\ was\ collected\ to\ study\ the\ effect\ of\ " + Item1lc + "\ on\ " + Item2lc + ".\\ Graph\ the\ data\ set.") → InstructionsQ2LaTeX("\textbf{Instructions\text{:}}\ First,\, drag\ the\ correct\ variable\ to\ the\ horizontal\ axis.") → Instructions2S1LaTeX("\textbf{Instructions\text{:}}\ Drag\ points\ onto\ the\ grid\ to\ graph\ the\ data\ set. ") → Instructions2S2LaTeX(("The\ \textbf{independent}\ variable\ affects\ the\\ dependent\ variable.\\ The\ \textbf{independent}\ variable\ goes\ on\\ the\ horizontal\ axis.\\This\ study\ looks\ at\ how\ " * Item1lc) + "\\ affects\ " + Item2lc + ".\\ Thus,\, " + Item1lc + "\ is\ the\\ independent\ variable.") → FeedbackQ2
AI Drawing Prompt Reference
Create a coordinate plane with horizontal and vertical axes from the origin, labeled with tick marks. Randomly place six integer-coordinate points in the grid area. Below the plane, show two draggable labels, one saying 'Time' and the other 'Money', for choosing the horizontal axis variable. Display a question text asking which variable should be on the horizontal axis. Include a feedback area with a checkmark and a cross symbol, plus instructional text for checking answers. The layout should be clean and interactive for students.
The prompt above was compiled from the original drawing commands and is for reference only.