
Approximating Pi Using Polygon Geometry and Confidence Intervals
Loading the math board and drawing, please wait…
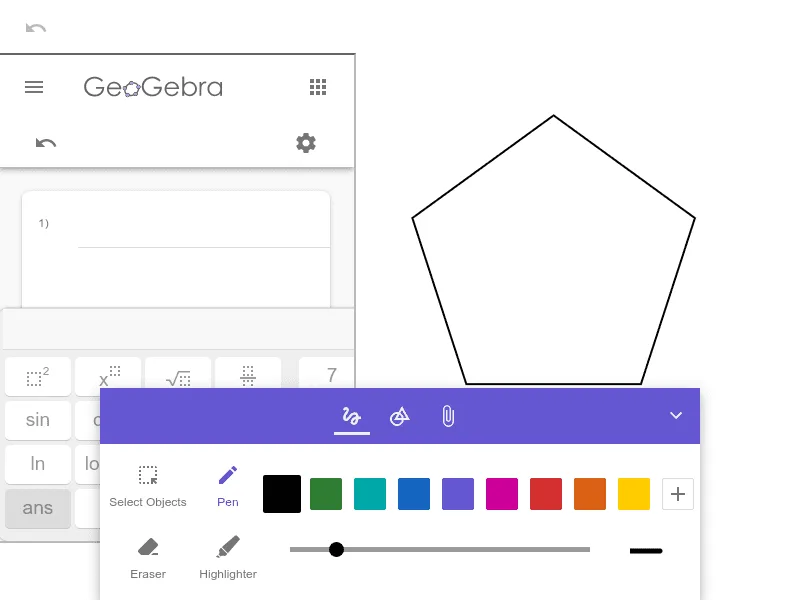
This example demonstrates how to approximate the constant π by inscribing or circumscribing polygons around a circle and using polygon perimeters to estimate the circle’s circumference. As the number of sides increases, the approximation improves, and the results can be summarized with a confidence interval to visualize uncertainty. The key mathematical ideas include: the geometric relationship between π and the circle’s circumference (via diameter/radius), polygon approximation of a circle (inscribed/circumscribed regular polygon intuition), coordinate-based construction of vertices on a circle, and statistical estimation concepts such as confidence intervals. In the construction, one first defines the circle (center and radius), then determines polygon vertex coordinates from equal angle steps (parameterized angles mapped to points on the circle), connects consecutive vertices to form the polygon, computes its perimeter, and forms π-approximations using the perimeter-to-diameter (or radius) ratio. Finally, multiple approximation values are used to display an uncertainty band as a confidence interval. This activity is well suited for advanced high school and early college contexts, especially for lessons combining geometry construction, numeric approximation, and basic statistics.
AI Drawing Prompt Reference
Draw a circle centered at the origin with a fixed radius. Mark equally spaced points on the circumference starting from the top, and connect consecutive points to form an inscribed regular polygon. As the number of sides increases, the polygon approximates the circle more closely. Also draw a circumscribed regular polygon outside the circle, with its sides tangent to the circle. Compute the perimeters of both polygons and divide by the diameter to estimate pi. Finally, below or beside the figure, draw a number line showing the estimates for different side counts, and shade a band representing the confidence interval to visualize how the approximations converge to the true value of pi.
The prompt above was compiled from the original drawing commands and is for reference only.