
Create a Scatter Plot
Loading the math board and drawing, please wait…
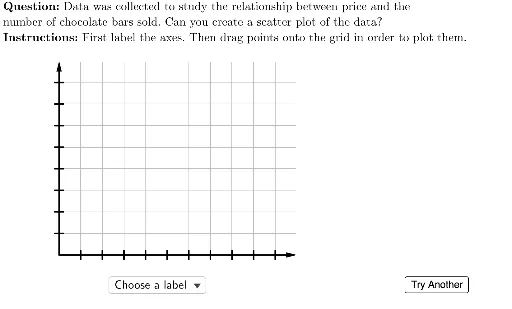
This example demonstrates how to create a scatter plot using GeoGebra. Core mathematical concepts include arithmetic mean, trigonometry, and limits. Commands such as Flatten, Point, Element are used to construct the scatter plot. Suitable for high school math education and learning.
GeoGebra Commands & Parameters
Flatten(Sequence[Sequence[(i, j), i, 0, 10, 1], j, 0, 8, 1]) → gridSpacePoint(Union[gridSpace, {homeBase}]) → EPoint(Union[gridSpace, {homeBase}]) → DPoint(Union[gridSpace, {homeBase}]) → CPoint(Union[gridSpace, {homeBase}]) → BElement(questionList, questionListIndex) → questionNumElement(H2:H6, questionNum) → yIncPoint(Union[gridSpace, {homeBase}]) → FElement(G2:G6, questionNum) → xIncElement(F2:F6, questionNum) → yValsElement(E2:E6, questionNum) → xValsElement(D2:D6, questionNum) → depVarWordsElement(C2:C6, questionNum) → indepVarWordsUnicodeToLetter(10007) → xmarkUnicodeToLetter(10003) → cmarkPoint(Union[gridSpace, {homeBase}]) → AZip((A / xInc, B / yInc), A, xVals, B, yVals) → correctPointsLaTeX((((("\text{" * QUESTION) * "\\") * INSTRUCTIONS) * "}")) → TEXTElement(B2:B6, questionNum) → dependentVariableElement(A2:A6, questionNum) → independentVariableVector((0, 0), (0, 9)) → yAxisLineVector((0, 0), (11, 0)) → xAxisLineSequence(Segment[(-0.2, i), (0.2, i)], i, 1, 8) → yTicksSequence(Segment[(i, -0.2), (i, 0.2)], i, 1, 10) → xTicksSequence(i, i, xInc, (10 * xInc), xInc) → xTickLabelsSequence(i, i, yInc, (10 * yInc), yInc) → yTickLabelsSequence(Text[Element[xTickLabels, i], (i - 0.2, -0.7)], i, 1, 10) → xAxisTickLabelsSequence(Text[Element[yTickLabels, i], (-1, i - 0.2)], i, 1, 8) → yAxisTickLabelsPolygon({(0, 0), (0, 9), (11, 9), (11, 0)}) → viewBoxTableText({Join[{{(("\cellcolor{#ffcc80}{" * independentVariable) * "}")}, xVals}], Join[{{(("\cellcolor{#ffcc80}{" * dependentVariable) * "}")}, yVals}]}, "|_vc") → dataZip(Circle[A, 0.3], A, correctPoints) → correctCirclesLaTeX("\text{Points to Plot:}") → pointsLabelJoin({{LaTeX["\text{Choose a label}"]}, Shuffle[{dependentVariable, independentVariable}]}) → axesLabelsSelectedElement(axesLabels) → selectedLabelRotateText(If[selectedLabel ≟ independentVariable, dependentVariable, If[selectedLabel ≟ dependentVariable, independentVariable, ""]], 90°) → otherLabelLaTeX((((((("\text{Since the " * indepVarWords) * " may cause\\the ") * depVarWords) * "\\to change, ") * indepVarWords) * " is the\\independent variable which is\\placed on the horizontal axis.}")) → feedbackLabels
AI Drawing Prompt Reference
Create a scatter plot with a coordinate grid, horizontal and vertical lines for axes, and tick marks with labels. Plot multiple points based on given x and y values, highlighting some with circles. Include axes, title, and explanatory text describing variable relationships and plotting purpose.
The prompt above was compiled from the original drawing commands and is for reference only.