
Completing the Square: Quadratic Graph Transformations
Loading the math board and drawing, please wait…
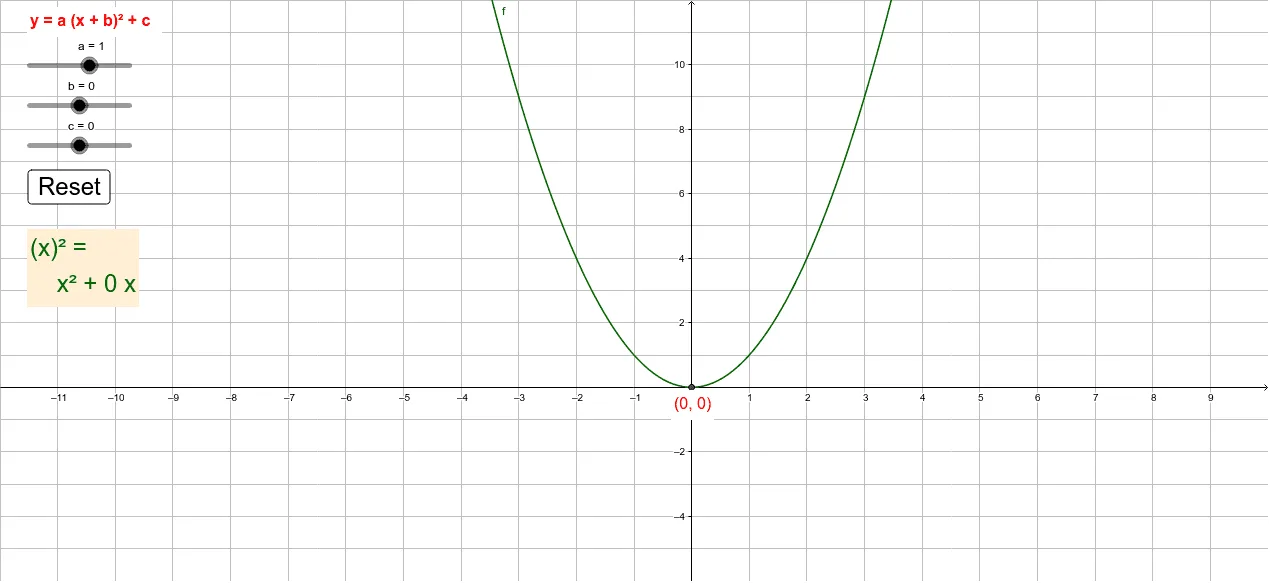
This example demonstrates how to complete the square for a quadratic function in general form, convert it to vertex form, and dynamically observe graph transformations including translation, opening direction, and extrema. Core concepts: completing the square for quadratic functions, vertex coordinates, and graph translation and scaling. Construction uses GeoGebra commands such as Extremum to find critical points, sliders to dynamically adjust parameters a, b, c, plot the function f(x)=ax²+bx+c in real-time, and text boxes to display the completing the square process and vertex coordinates, showing how parameter changes affect the graph. Suitable for middle school quadratic function graphing, high school function transformation review, and math competition practice.
GeoGebra Commands & Parameters
Extremum(f) → A
AI Drawing Prompt Reference
Please draw a parabola graph to demonstrate the dynamic changes of the quadratic function f(x)=ax²+bx+c. Include sliders for parameters a, b, c to adjust the shape and position of the function. Add vertex coordinates and text boxes to display the completing the square process and vertex information. Key objects include the parabola, vertex, parameter sliders, and text boxes. Parameter changes affect the opening direction, translation, and extrema of the parabola. The construction order is: first set the parameter sliders, then draw the function, and finally add text boxes to show the graph transformations.
The prompt above was compiled from the original drawing commands and is for reference only.