
Compare MAD range to IQR in Dot Plot
Loading the math board and drawing, please wait…
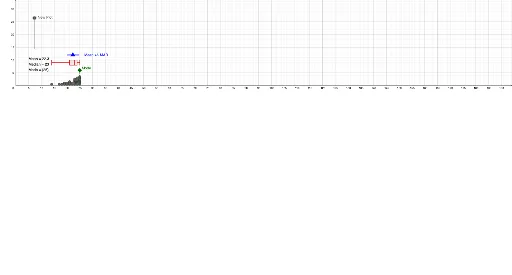
This example demonstrates comparing Mean Absolute Deviation (MAD) and Interquartile Range (IQR) through a dot plot. Key math concepts include MAD, IQR, and data distribution. It uses GeoGebra commands like Mode, DotPlot, Textfield, mad, Median, Segment, and BoxPlot for construction. Ideal for high school students learning statistics and data analysis.
GeoGebra Commands & Parameters
Mode(l1) → l4DotPlot(l1, false, 0.5) → l10DotPlot(l2, false, 0.5) → l11DotPlot(l3, false, 0.5) → l12Textfield() → InputBox1mad(l1) → emad(l2) → fmad(l3) → gMedian(l1) → hMedian(l2) → iMedian(l3) → jSegment(A, B) → nSegment(C, D) → pSegment(F, G) → qBoxPlot(D1, D2, l1) → kBoxPlot(D1, D2, l2) → lBoxPlot(D1, D2, l3) → mMode(l2) → l5Mode(l3) → l6Segment(K, K_{1}) → rSegment(L, L_{1}) → sSegment(M, M_{1}) → t
AI Drawing Prompt Reference
Create a dot plot to compare the mean absolute deviation and interquartile range of three datasets. Plot three dot plots first, then calculate the mean absolute deviation and median for each dataset. Connect key points with line segments to represent the interquartile range, and finally draw three box plots to compare the data distributions.
The prompt above was compiled from the original drawing commands and is for reference only.