
Geometric Exploration of Mean Absolute Deviation (MAD)
Loading the math board and drawing, please wait…
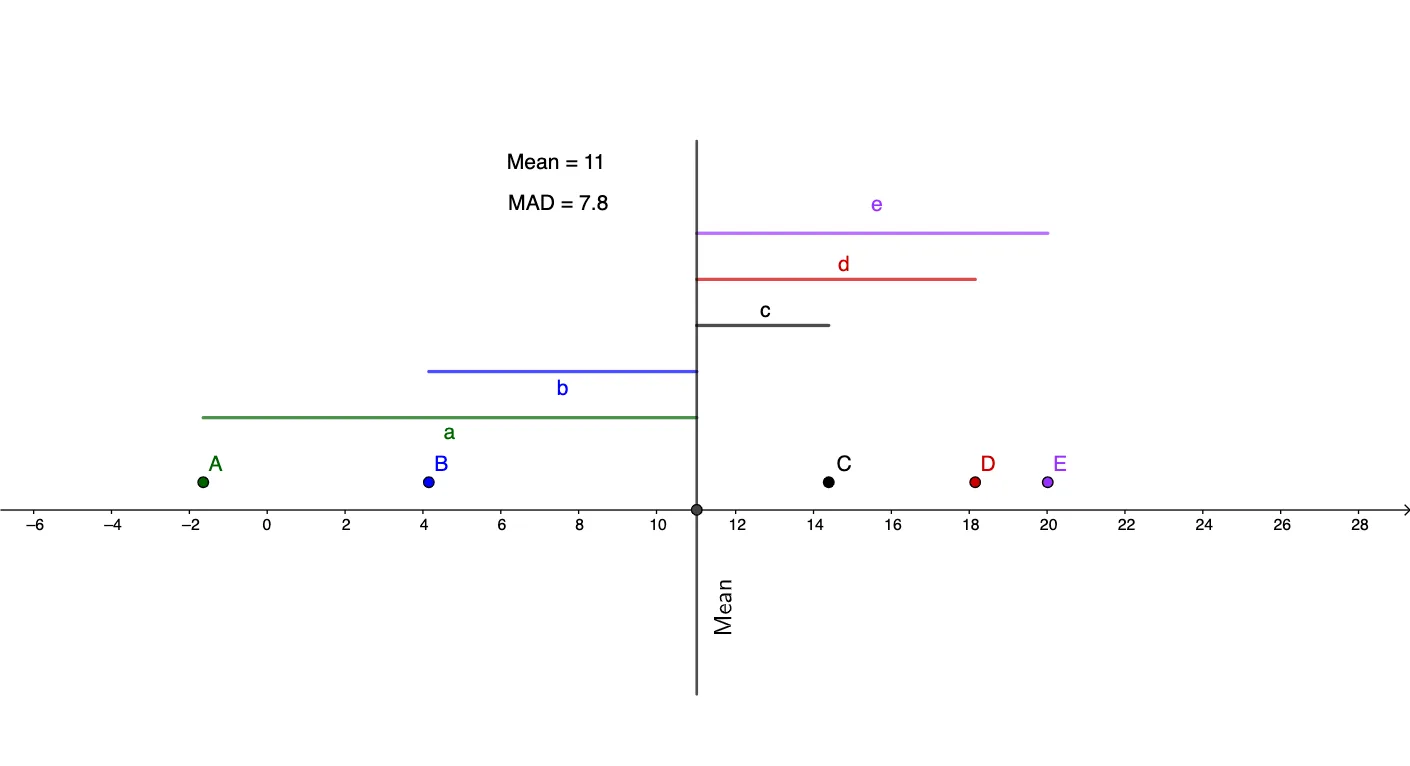
This example demonstrates how the Mean Absolute Deviation (MAD) measures data dispersion by constructing the distance from each data point to the arithmetic mean and then aggregating these absolute deviations. It focuses on key concepts from statistics and arithmetic operations: arithmetic mean, absolute deviation, and the definition/interpretation of MAD. In the GeoGebra construction, it uses commands such as RotateText, mean, mad, and Segment to compute and visualize the mean and MAD, create distance-related line segments, and label results. The construction involves multiple point objects (e.g., A1–A5, B1–B5 and additional points like A, B, C, D, E) together with text labels (text1–text3) showing Mean and mad, plus helper elements (e.g., l1) for layout. Suitable for late secondary school to introductory university coursework, especially for learning robust dispersion measures and linking statistical formulas to geometric intuition.
GeoGebra Commands & Parameters
RotateText("Mean", 90°) → text2mean(l1) → meanmad(l1) → madSegment((A1, 1), (mean, 1)) → aSegment((A2, 1.5), (mean, 1.5)) → bSegment((A3, 2), (mean, 2)) → cSegment((A4, 2.5), (mean, 2.5)) → dSegment((A5, 3), (mean, 3)) → eSegment((x(Mean), -2), (mean, 4)) → f
AI Drawing Prompt Reference
Draw a graph showing the mean absolute deviation. There is a point representing the mean, and other points representing data points. Line segments connect each data point to the mean, showing the absolute deviation. Labels indicate the mean and the MAD. The layout is clear and suitable for teaching.
The prompt above was compiled from the original drawing commands and is for reference only.