
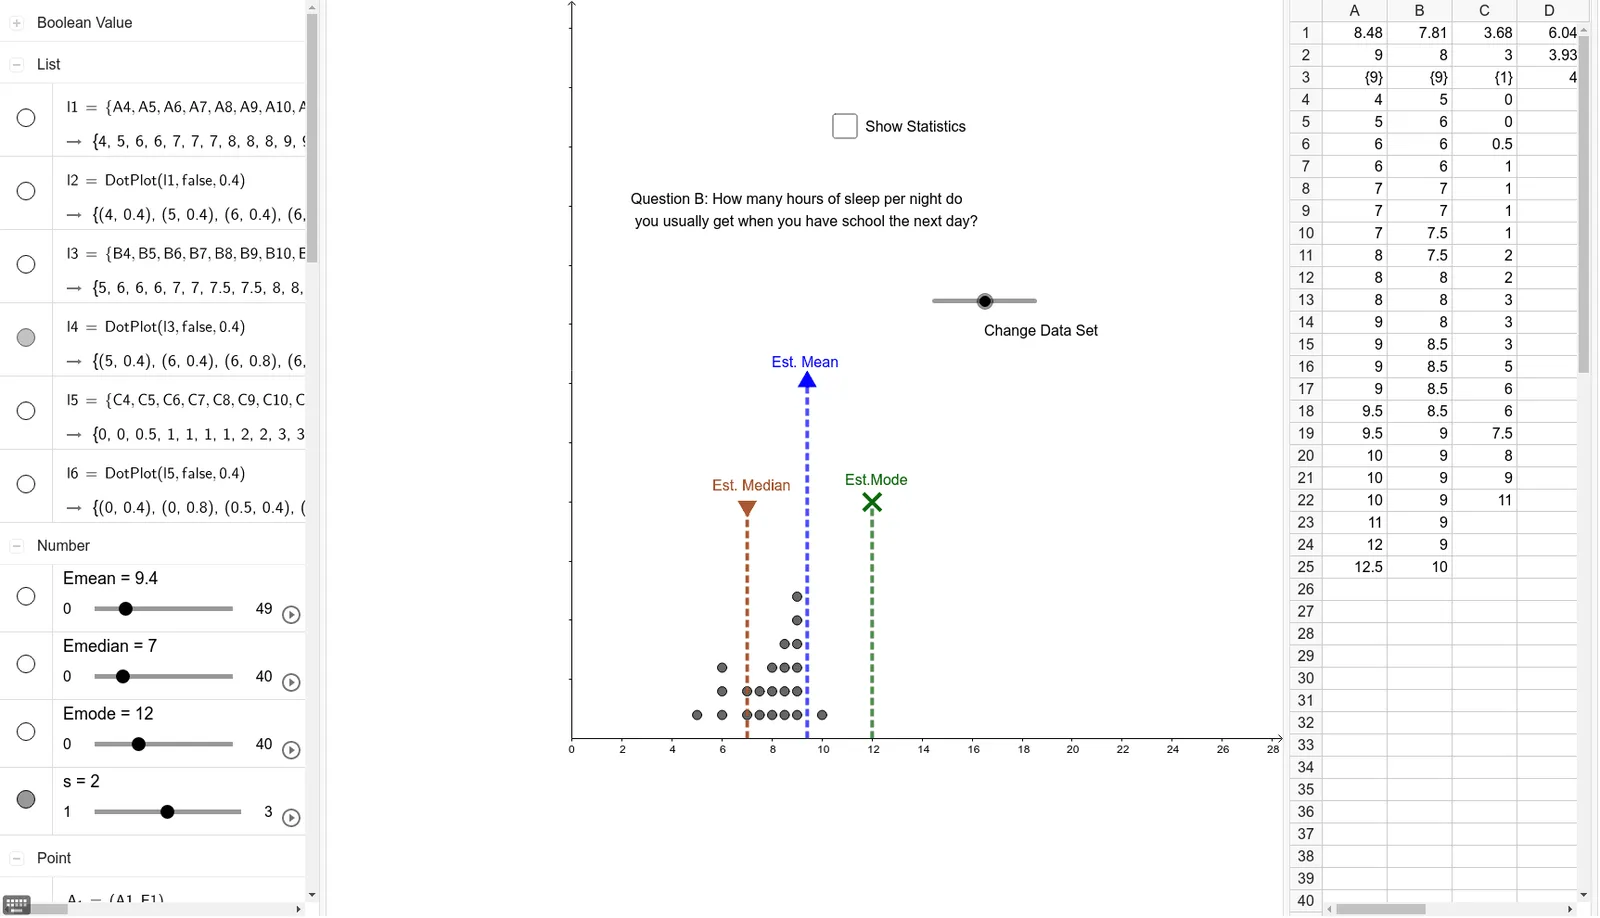
Estimating Measures of Center on a Dot Plot
Loading the math board and drawing, please wait…
This example demonstrates how to estimate measures of center such as mode, median, and mean using a dot plot. It utilizes GeoGebra commands like DotPlot and Segment. Suitable for middle school and above students learning basic statistics.
GeoGebra Commands & Parameters
Mode(A4:A25) → A3Median(A4:A24) → A2Median(B4:B24) → B2Mode(B4:B24) → B3mean(B4:B24) → B1Median(C4:C24) → C2Mode(C4:C24) → C3mean(C4:C24) → C1mean(A4:A25) → A1DotPlot(l5, false, 0.4) → l6DotPlot(l3, false, 0.4) → l4DotPlot(l1, false, 0.4) → l2Segment((Emedian, 0), (Emedian, D2)) → gSegment((Emode, 0), (Emode, D3)) → hSegment((Emean, 0), (Emean, D1)) → fSegment(B_{1}, (B1, F1)) → lSegment(C_{1}, (C1, F1)) → pSegment(C_{2}, (C2, F2)) → qSegment(C_{3}, (C3(1), F3)) → rSegment(A_{3}, (A3(1), F3)) → kSegment(A_{1}, (A1, F1)) → iSegment(A_{2}, (A2, F2)) → jSegment(B_{2}, (B2, F2)) → mSegment(B_{3}, (B3(1), F3)) → n