
Broken Wand: Geometric Construction to Explore Mean, Variance, and Mode
Loading the math board and drawing, please wait…
In collections
Introductory Exercises
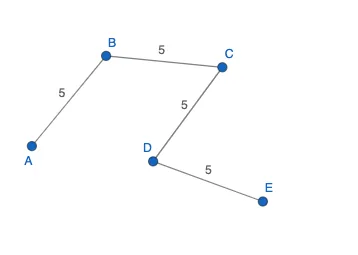
This GeoGebra example demonstrates how a “broken” geometric arrangement can be used as a visual scaffold to study statistical characteristics. By placing and connecting a sequence of points into segments, the model supports forming data-like collections and then relating them to key summary measures. The main mathematical concepts include combinatorics (building possible value sets), arithmetic mean, variance, and mode—quantities that describe central tendency and spread. Construction-wise, the provided summary indicates the core GeoGebra commands are Point and Segment: it creates point objects A, B, f, C, g, D, h, E, i and links selected points with segments to form the broken-wand geometry. The resulting figure is suitable for middle and high school learners, classroom demonstrations, and self-study on combining geometric construction with basic probability & statistics reasoning.
GeoGebra Commands & Parameters
Point(Circle[A, 5]) → BSegment(A, B) → fPoint(Circle[B, 5]) → CSegment(B, C) → gPoint(Circle[C, 5]) → DSegment(C, D) → hPoint(Circle[D, 5]) → ESegment(D, E) → i
AI Drawing Prompt Reference
Draw a geometric figure consisting of multiple points and line segments connecting them, starting from a point and sequentially creating new points on circles of radius 5 centered at each previous point, connecting adjacent points with line segments to form a broken wand-like shape, showcasing the connection relationships between points and the geometric construction process.
The prompt above was compiled from the original drawing commands and is for reference only.