
Box Plot by Ben Roth
Loading the math board and drawing, please wait…
In collections
Statistics & Probability
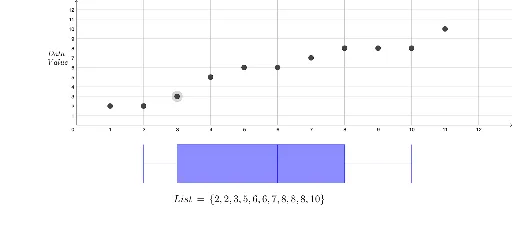
This example demonstrates how to create a box plot, a statistical chart that shows the distribution of a dataset. Key mathematical concepts include the median, quartiles, and outliers. Using GeoGebra commands such as BoxPlot, Sort, and Max, the box plot can be easily constructed. Suitable for middle school and above students to learn data statistics and analysis.
GeoGebra Commands & Parameters
BoxPlot(-4, 2, {A2, B2, C2, D2, E2, F2, G2, H2, I2, J2, K2}, true) → aLaTeX(List_1, true, true) → text1Sort(List_1) → ListLaTeX(List, true, true) → text2Max(List) → b
AI Drawing Prompt Reference
Create a box plot to show the distribution of a dataset. First, input the data points from A2 to K2, then generate the box plot using the BoxPlot command. Next, sort the data and display the sorted list. Finally, find the maximum value in the dataset.
The prompt above was compiled from the original drawing commands and is for reference only.