
Binomial Distribution B(n,p) with Sliders
Loading the math board and drawing, please wait…
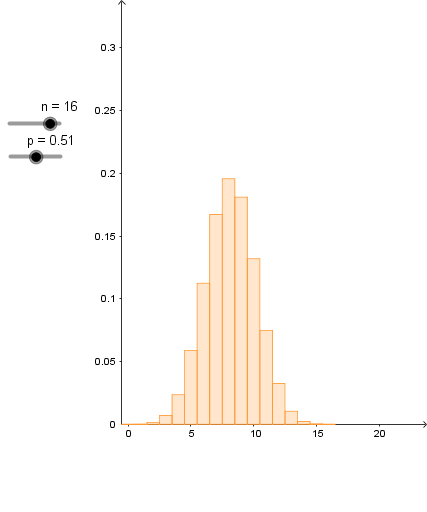
This GeoGebra example provides an interactive demonstration of the binomial distribution B(n,p) using sliders to adjust the number of trials n and success probability p in real time, allowing users to observe how the probability mass function changes. Core mathematical concepts include the binomial distribution, probability mass function, expected value, variance, and properties of discrete random variables. The construction uses the BarChart command to create a bar chart, with objects p, n, and A (where A likely represents probabilities or distribution data) linked to sliders for dynamic parameter control. This resource is suitable for high school and undergraduate statistics courses, helping students visualize the effect of parameters on the shape of the distribution, understand the relationship between n, p, and the spread/center, and interpret probability histograms.
GeoGebra Commands & Parameters
BarChart(-0.5, n + 0.5, Sequence[((Binomial[n, k] * p^(k)) * (1 - p)^(n - k)), k, 0, n]) → A