
Normal Distribution with Variable Tail Areas
Loading the math board and drawing, please wait…
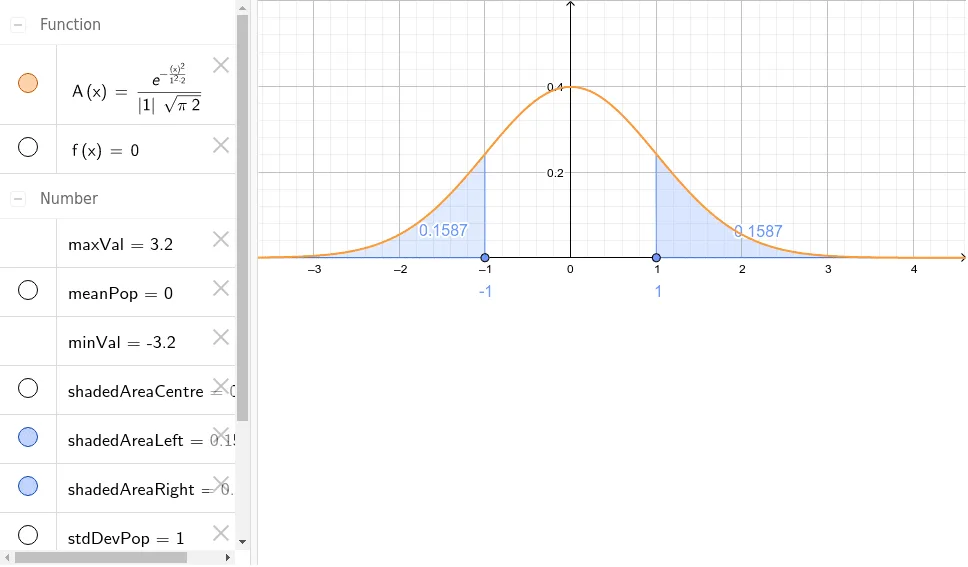
This example demonstrates how the areas under the tails of a normal distribution change as parameters vary. Key math concepts include normal distribution, probability density function, integration, and hypothesis testing. Construction highlights involve using commands like Normal for the curve, Point for creating points, and IntegralBetween for calculating areas, with sliders and objects such as meanPop and stdDevPop to manipulate parameters. The visualization shows shaded areas (left, right, center) corresponding to different regions. Suitable for high school and above students/teachers learning probability distributions and statistical inference.
GeoGebra Commands & Parameters
Normal(meanPop, stdDevPop, x) → APoint(xAxis) → PPoint(xAxis) → QIntegralBetween(A, f, x(P), x(Q)) → shadedAreaCentreIntegralBetween(A, f, x(Q), 100) → shadedAreaRightIntegralBetween(A, f, -100, x(P)) → shadedAreaLeft
AI Drawing Prompt Reference
Draw a normal distribution curve with shaded areas on both sides and in the center to represent different probability ranges. Use sliders to adjust the mean and standard deviation, making the curve change accordingly. Place two points on the x-axis, serving as the integration bounds for the central shaded area, and for the left and right shaded areas respectively.
The prompt above was compiled from the original drawing commands and is for reference only.