
Normal Distribution with Variable Central Area
Loading the math board and drawing, please wait…
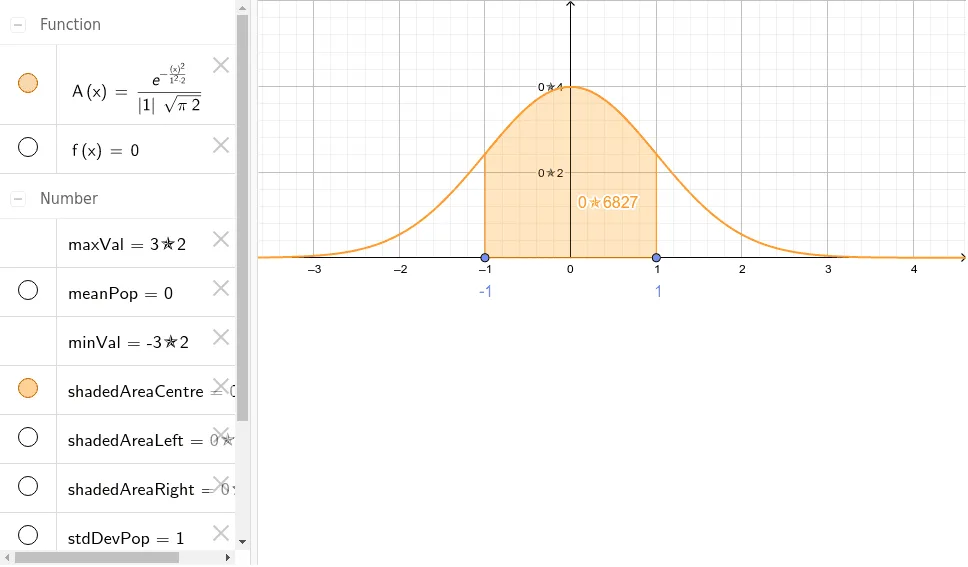
This example demonstrates a normal distribution where the central area is variable. Key mathematical concepts include normal distribution, integration, and probability & statistics. Using GeoGebra commands such as Normal, Point, and IntegralBetween, the user can construct a normal distribution curve with adjustable mean and standard deviation, and calculate the areas of different regions. Suitable for high school and above students or teachers for teaching or researching properties of normal distribution.
GeoGebra Commands & Parameters
Normal(meanPop, stdDevPop, x) → APoint(xAxis) → PPoint(xAxis) → QIntegralBetween(A, f, x(P), x(Q)) → shadedAreaCentreIntegralBetween(A, f, x(Q), 100) → shadedAreaRightIntegralBetween(A, f, -100, x(P)) → shadedAreaLeft
AI Drawing Prompt Reference
Draw a normal distribution curve that can be adjusted for mean and standard deviation, and calculate and display three areas under the curve: the central area, the right area, and the left area. First, set the mean and standard deviation, then draw the normal distribution curve, mark two points on the curve as the boundaries of the areas, and finally calculate and display the areas of these three regions.
The prompt above was compiled from the original drawing commands and is for reference only.