
Bar Chart Construction
Loading the math board and drawing, please wait…
In collections
Charts & Graphs
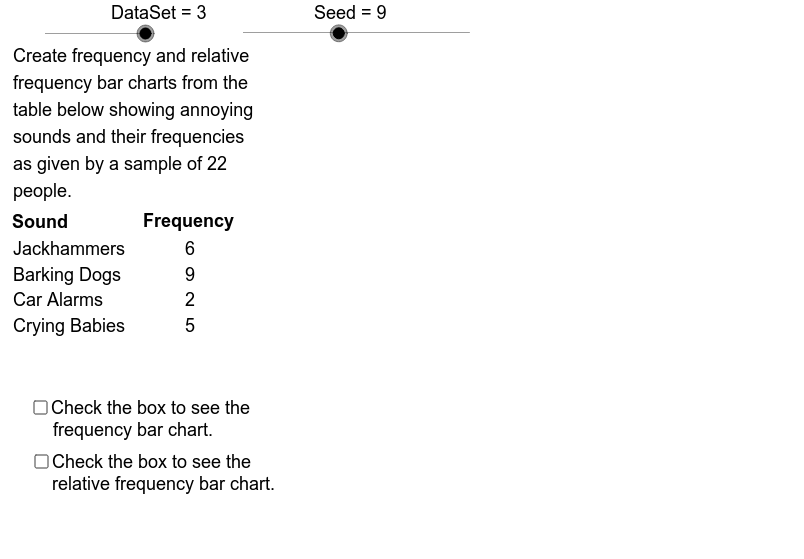
This example demonstrates how to create frequency and relative frequency bar charts from categorical data. It involves core concepts like data categorization, frequency statistics, and relative frequency calculation. The construction utilizes GeoGebra commands such as Sequence, Element, RemoveUndefined, Max, Mod, CountIf, Sum, and Segment, along with objects like DataSet, FrqMax, CatC, and CatLab. It is suitable for high school statistics education and introductory data analysis learning.
GeoGebra Commands & Parameters
Sequence(If[k > 79, 4, If[k > 66, 3, If[k > 28, 2, 1]]], k, 1, 100) → DtSq3Sequence(If[k > 91, 5, If[k > 69, 4, If[k > 57, 3, If[k > 51, 2, 1]]]], k, 1, 100) → DtSq2Sequence(If[k > 96, 6, If[k > 91, 5, If[k > 85, 4, If[k > 79, 3, If[k > 66, 2, 1]]]]], k, 1, 100) → DtSq1Element(DtSqSq, DataSet) → DtSqSequence(Element[DtSq, Mod[Seed + 47 * k, 100] + 1], k, 1, Sz1) → AcDtElement(CatNoSq, DataSet) → CatNo1Sequence(CountIf[x ≟ k, AcDt], k, 1, CatNo1) → FrqSq1Sequence(If[Element[FrqSq1, k] ≟ 0, NaN, Element[FrqSq1, k]], k, 1, CatNo1) → FrqSq2RemoveUndefined(FrqSq2) → FrqSq3Max(FrqSq3) → FrqMaxMax(1, floor(FrqMax / 3)) → FrqUntMod(Seed, 10) → StartElement(CatLabSq, DataSet) → CatLabElement(IndPrcSq, DataSet) → IndPrcElement(CatSq, DataSet) → Cat1Sequence(Sum[First[IndPrc1, k]], k, 1, 5) → CmlPrc1Sequence(Sum[First[IndPrc2, k]], k, 1, 4) → CmlPrc2Sequence(Sum[First[IndPrc3, k]], k, 1, 3) → CmlPrc3Sequence(If[Element[FrqSq2, k] ≠ 0, Element[Cat1, k]], k, 1, CatNo1) → Cat2RemoveUndefined(Cat2) → Cat3CountIf(x > 0, FrqSq1) → CatNo2Sum(FrqSq3) → Sz2Sequence(Element[FrqSq3, k] / Sz2, k, 1, CatNo2) → RFSqSequence(Text[Element[Cat3, k], (-4, ClTp - 0.1 * k)], k, 1, CatNo2) → CatTxtSequence(Text[Element[FrqSq3, k], (15, ClTp - 0.1 * k)], k, 1, CatNo2) → FrqTxt1Segment(UL, LL) → FrqAxSegment(LL, LR) → HrAxSegment(LR, UR) → RFAxSequence(Segment[(GL + (k - 1) * CW, Adpt(Element[FrqSq3, k])), (GL + k * CW, Adpt(Element[FrqSq3, k]))], k, 1, CatNo2) → BrTpSegment(LL, (GL, Adpt(Element[FrqSq3, 1]))) → LftSdSegment(LR, (GR, Adpt(Element[FrqSq3, CatNo2]))) → RgtSdSequence(Segment[(GL + k * CW, GB), (GL + k * CW, Adpt(Max[Element[FrqSq3, k], Element[FrqSq3, k + 1]]))], k, 1, CatNo2 - 1) → BrSdSequence((GL + (k - 0.6) * CW - 0.5, GB + 0.02), k, 1, CatNo2) → LblLcSqSequence(VerticalText[Element[Cat3, k], Element[LblLcSq, k]], k, 1, CatNo2) → BrLblSqElement(TtlSq, DataSet) → TitleSequence(Text[k, (GL - 3.5, GB + k * FrqScl - 0.02)], k, 0, AxMax, FrqUnt) → FrqLbSqSequence(Segment[(GL - 1, Adpt(k)), (GL, Adpt(k))], k, 0, AxMax, FrqUnt) → FrqAxTcSequence(Segment[(GR, Adpt(k)), (GR + 1, Adpt(k))], k, 0, AxMax, FrqUnt) → RFAxTcSequence(Text[k / Sz2, (GR + 1.1, GB + k * FrqScl - 0.02)], k, 0, AxMax, FrqUnt) → RFLblSq
AI Drawing Prompt Reference
Create a bar chart to display frequency and relative frequency of categorical data. Start by generating three sequences based on the data to represent frequencies of different categories, then extract data points from these sequences to calculate frequency and relative frequency for each category. Draw bars with heights proportional to frequencies, label category names and frequency values. Add axes and a title to complete the chart.
The prompt above was compiled from the original drawing commands and is for reference only.