
Average Rate of Change of a Function Quiz by Tim Brzezinski
Loading the math board and drawing, please wait…
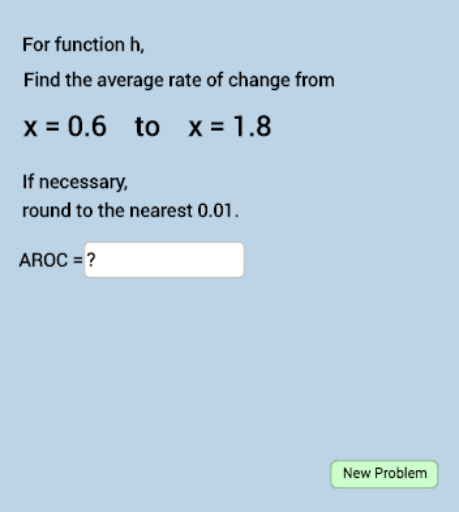
This example demonstrates calculating the average rate of change of a function using table values. Key math concepts include functions, average rate of change, and slope. GeoGebra commands used include Random, Sequence, RandomElement, etc. Suitable for high school math education and learning.
GeoGebra Commands & Parameters
Random(1, 3) → nSequence(i, i, -2, 2, 0.1) → alistRandomElement(alist) → aRandomElement(blist) → bSequence(i, i, -2, 1.8, 0.1) → clistRandomElement(clist) → cRandomElement(mlist) → mRandomElement(clist) → startSequence(i, i, start + 0.2, 2, 0.1) → endlistRandomElement(endlist) → endSlope(f) → ans1FractionText(ans1) → text1FractionText(ans2) → text2FractionText(ans3) → text3Polygon(A, G, B) → poly1, b_1, a_1, g_1Segment(B, G) → iSegment(G, A) → jPolygon(C, H, D) → poly2, d, c_1, h_1Segment(C, H) → kSegment(H, D) → lPolygon(E, I, F) → poly3, f_1, e, i_1Segment(F, I) → pSegment(I, E) → qSegment(F, E) → rSegment(C, D) → sSlope(s) → m_1Slope(r) → m_2Slope(f) → m_3Textfield(o) → InputBox1Midpoint(C, D) → JMidpoint(A, B) → KMidpoint(E, F) → L
AI Drawing Prompt Reference
Draw a function graph with points A and B, and a line segment AB with slope m. Then draw points C and D, and a line segment CD. Next, draw points E and F, and a line segment EF. Calculate the slopes of line segments AB, EF, and CD, and label them as m1, m2, and m3 respectively. Finally, draw the midpoints J, K, and L of segments AB, CD, and EF.
The prompt above was compiled from the original drawing commands and is for reference only.