
Area Function as Antiderivative – Dynamic Integral Visualization
Loading the math board and drawing, please wait…
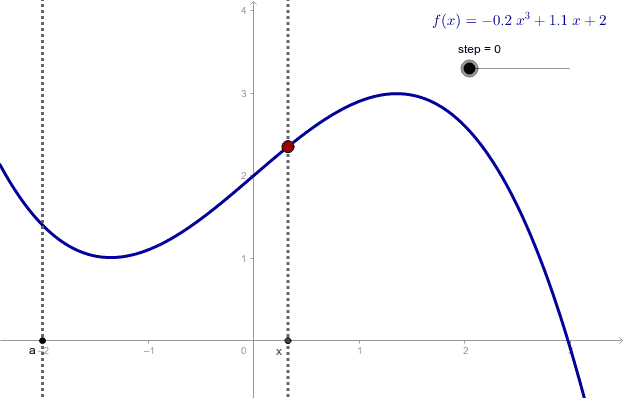
① This example demonstrates how the area under a function's graph, accumulated from a fixed lower limit to a variable upper limit, forms an area function that serves as an antiderivative of the original function. ② Core mathematical concepts include definite integrals, area functions, antiderivatives (reverse derivatives), and the fundamental relationship between integration and area accumulation. Additional elements such as similar triangles, squares, arithmetic, sine functions, and random variables appear as auxiliary contexts, but the main focus is integral calculus. ③ Construction highlights: Using GeoGebra commands like Point, Integral, Line, Intersect, Segment, and Polygon, the applet builds the function f, the integral region, the area polygon poly1, and multiple text objects. A step slider controls the increment, dynamically updating the area value and visually linking the area to the integral. ④ This is suitable for senior high school or early university students learning calculus, helping them grasp the idea that the area function is an antiderivative, and it also serves as an effective classroom demonstration tool for teachers.
GeoGebra Commands & Parameters
Point(f) → AIntegral(f, x(C), x(A)) → dPoint(f) → DLine(A, xAxis) → gIntersect(e, g) → ESegment(A, E) → hIntegral(f, x(C), x(D)) → iIntegral(f, x(A), x(D)) → jPolygon(B, G, E, A) → poly1, b_1, g_1, e_1, a_1Segment(D, G) → k
AI Drawing Prompt Reference
Draw a function graph and display the integral area from a fixed lower limit to a variable upper limit. Use a dynamic slider to control the upper limit, showing the change in the area of the integral region, and demonstrate that the area function is an antiderivative of the original function. Include integral lines, intersection points, connecting line segments, and an area polygon, all dynamically linked to visually illustrate the relationship between integration and area accumulation.
The prompt above was compiled from the original drawing commands and is for reference only.