
Animation Demonstrating Isosceles Triangles and Linear Regression
Loading the math board and drawing, please wait…
In collections
Congruence (CO) Cluster
CCSS High School: Geometry (Congruence) Volume 1
CCSS High School: Geometry (Congruence) Volume 1
CCSS High School: Geometry (Congruence) Volume 1
Congruence: Volume 1 - Chapter 1
Congruence: Volume 1 - Chapter 1
Congruence V1C1 Check
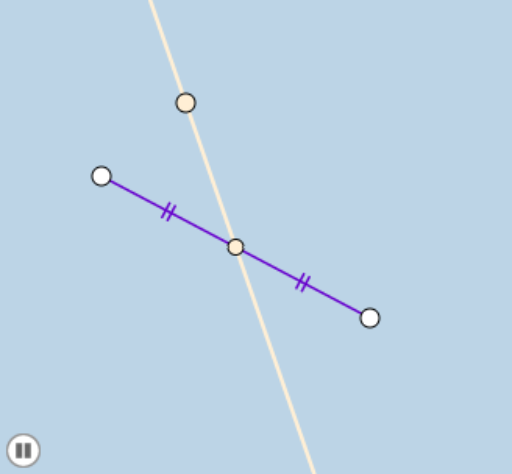
This example demonstrates the construction and properties of isosceles triangles through animation, alongside the application of linear regression. Key mathematical concepts include subtraction, continuity, isosceles triangles, hypothesis testing, and linear regression. The construction involves commands like Segment, Midpoint, Line, and Rotate to create objects A, B, f, C, g, h, D, i, j, a, A', C', j'. Suitable for high school mathematics education, this example helps students understand geometric transformations and data analysis.
GeoGebra Commands & Parameters
Segment(A, B) → fMidpoint(f) → CSegment(A, C) → gSegment(C, B) → hLine(C, D) → iSegment(A, C) → jRotate(A, If[0.5 < a ≤ 1.5, ((-(a - 0.5)) * π), (-π)], C) → A'Rotate(C, If[0.5 < a ≤ 1.5, ((-(a - 0.5)) * π), (-π)], C) → C'Segment(A', C') → j'
AI Drawing Prompt Reference
Draw an isosceles triangle ABC. Create segment f between points A and B, and midpoint C. Draw segments g and h connecting AC and CB. Draw line i through point C. Rotate points A and C to get A' and C', and draw segment j' connecting A' and C'. Use slider a to control the rotation angle, demonstrating the properties of isosceles triangles and linear regression.
The prompt above was compiled from the original drawing commands and is for reference only.