
Amstadter Connections Map: Segment Links and Centroid–Polynomial Structure
Loading the math board and drawing, please wait…
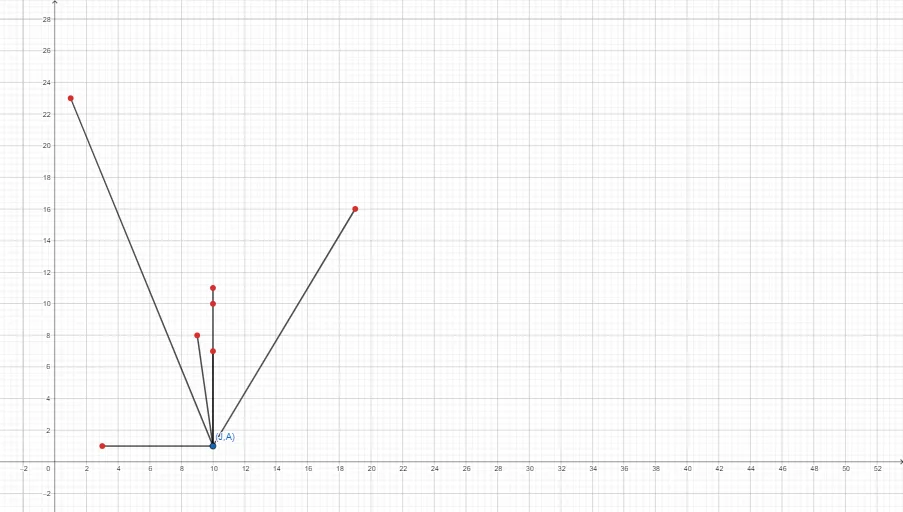
This example demonstrates a “Connections Map” that visualizes how multiple geometric elements are linked within a coordinate framework, converging toward key points such as the centroid/barycenter. The construction emphasizes structural relationships that connect metric ideas (including volume-related intuition), natural-number labeling, and polynomial-function-driven placement. Key concepts include segment connections in coordinate geometry, the centroid/barycenter principle, and how polynomial functions can govern or reflect positional/metric structure. Construction highlights: from the GeoGebra construct summary, the primary command is Segment, creating line segments among the objects A, B, C, D, E, F, G, H and additional named elements such as i, j, k, together with function objects f, g, h that correspond to parts of the mapping. The resulting network of segments forms the visual linkage map. Suitable for high school to early university learners, especially for geometry/coordinate-geometry lessons and math visualization activities.
GeoGebra Commands & Parameters
Segment(A, B) → fSegment(A, C) → gSegment(A, D) → hSegment(A, E) → iSegment(A, H) → jSegment(A, G) → k
AI Drawing Prompt Reference
Draw a “connections map” on a coordinate plane: take a point A and connect it with line segments to the points B, C, D, E, H, and G. The key is to make each segment clearly visible so the structure of multiple geometric links within the same coordinate framework is emphasized. Build it in order by first drawing the segment from A to B, then adding the segments from A to C, A to D, A to E, A to H, and finally A to G, until the full network of connections is formed.
The prompt above was compiled from the original drawing commands and is for reference only.