
Canete: Connections Map with Tangent-Function Geometry
Loading the math board and drawing, please wait…
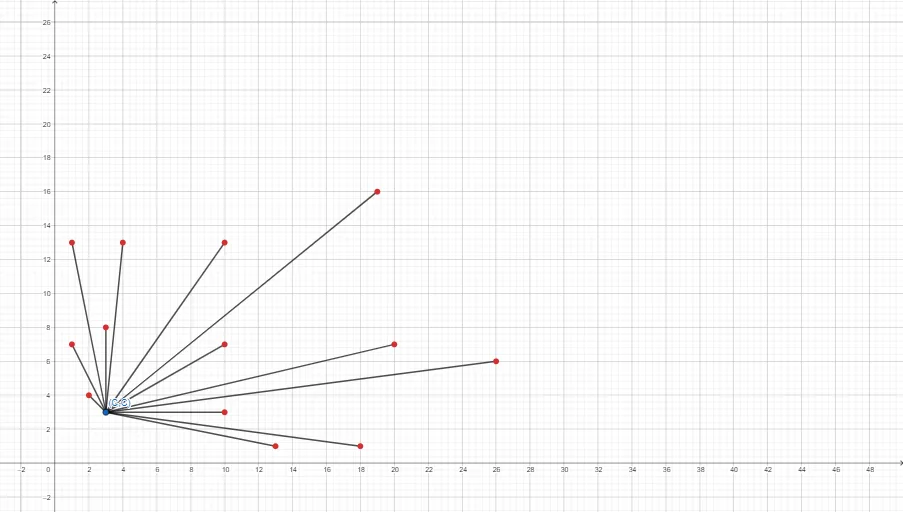
This example demonstrates how a “connections map” of constructed segments can reveal a structural correspondence between geometric points and function-driven relationships—highlighting intersection patterns and symmetric/kite-like configurations. Key math ideas include coordinate/analytic geometry, line segments, intersection points, tangent-function construction principles, and supporting arithmetic operations (e.g., arithmetic mean), alongside exponent-related components as indicated by the original topic tags. Construction-wise, the provided GeoGebra summary shows the central use of the Segment command to build a network of many essential objects (A, B, f, C, g, D, h, E, i, F, j, G, k, H, l, I, m, J, n, K, p, L, M, N, q, r, s). These segment connections organize points—some tied to function-dependent auxiliary quantities—into an explicit visual linkage map; intersections then become the observable loci where the underlying functional geometry expresses itself. Suitable for high school to early undergraduate learners for lessons on geometric construction, coordinate geometry, and visualizing function relationships through interactive diagrams.
GeoGebra Commands & Parameters
Segment(A, B) → fSegment(A, C) → gSegment(A, D) → hSegment(A, E) → iSegment(A, F) → jSegment(A, G) → kSegment(A, H) → lSegment(A, I) → mSegment(A, J) → nSegment(A, K) → pSegment(A, M) → qSegment(A, L) → rSegment(A, N) → s
AI Drawing Prompt Reference
Draw a network of segments centered at point A, connecting multiple points B, C, D, E, F, G, H, I, J, K, L, M, N. These segments organize points into a structured connection map, showing the correspondence between geometric points and function-driven relationships. Pay attention to the intersection points, which reveal the structural features of the function geometry.
The prompt above was compiled from the original drawing commands and is for reference only.