
Romo: Line-Segment Connections and Vector Geometry Map
Loading the math board and drawing, please wait…
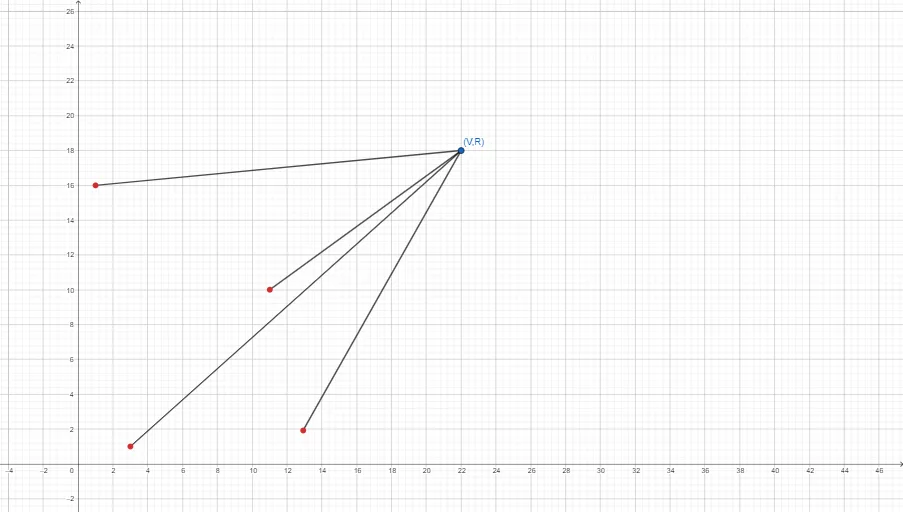
This example demonstrates how to build a “connections map” in geometry by drawing multiple line segments that encode a clear network-like structure. It emphasizes visualizing relationships among points through geometric connections, linking the idea of connectivity with vector-style interpretation (direction and geometry of linked parts). The key concepts include coordinate-geometry representation of points and segments, geometric understanding of vectors, and using a set/relationship viewpoint to organize how endpoints and constructed objects relate. Construction-wise, the build summary indicates the use of GeoGebra’s Segment command to create the objects A, B, f, C, g, D, h, E, i, forming a sequence of connected geometric components. The result is well suited for geometry construction practice, middle/high-school math lessons, and enrichment activities where students model and reason about structured connections using dynamic geometry tools.
GeoGebra Commands & Parameters
Segment(A, B) → fSegment(A, C) → gSegment(D, A) → hSegment(E, A) → i
AI Drawing Prompt Reference
Draw a graph with multiple line segments connecting points A, B, C, D, and E, forming line segments f, g, h, and i. Segment f connects A and B, segment g connects A and C, segment h connects D and A, and segment i connects E and A. These segments create a network structure showing the connections between points.
The prompt above was compiled from the original drawing commands and is for reference only.