
Amplitude, Period, and Midline of Sine Function
Loading the math board and drawing, please wait…
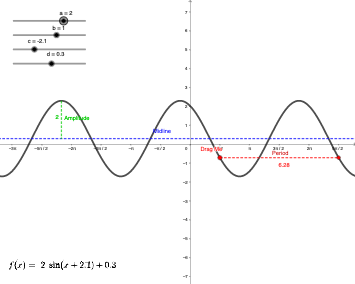
This example demonstrates the graphical features of the sine function, including amplitude, period, and midline. The key mathematical concepts involve basic properties of trigonometric functions. Construction involves GeoGebra commands such as Min, Max, OrthogonalLine, etc. Suitable for high school mathematics teaching or self-study.
GeoGebra Commands & Parameters
Min(f, (-10 * pi), (10 * pi)) → BMax(f, (-10 * pi), (10 * pi)) → AOrthogonalLine(A, g) → hIntersect(g, h) → CSegment(A, C) → iOrthogonalLine(B, g) → jIntersect(g, j) → DSegment(D, B) → kPoint(f) → ESegment(E, F) → lMidpoint(F, E) → GMidpoint(D, B) → IMidpoint(A, C) → J
AI Drawing Prompt Reference
Draw the sine function graph, including amplitude, period, and midline. First, find the maximum value A and minimum value B of function f in the range from -10π to 10π. Then, draw a perpendicular line h from A to function g, and find the intersection point C of h and g. Draw a line segment from A to C. Next, draw a perpendicular line j from B to g, and find the intersection point D of j and g. Draw a line segment from D to B. Choose a point E on f, draw a line segment from E to the midpoint G of f, and draw line segments from the midpoints I of D and B, and J of A and C.
The prompt above was compiled from the original drawing commands and is for reference only.