
Addition of Two Sine Functions
Loading the math board and drawing, please wait…
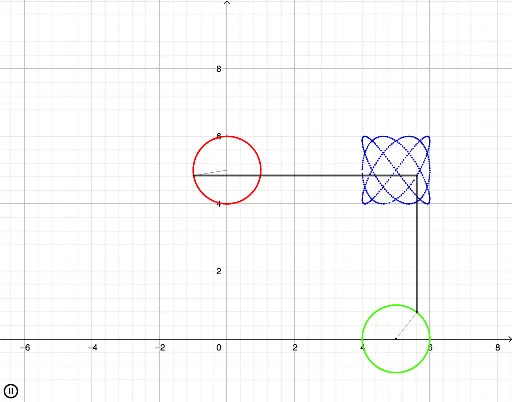
This GeoGebra example dynamically demonstrates the superposition of two sine functions, showing how their sum produces a composite waveform with periodic characteristics. The core mathematical concepts include amplitude, frequency, phase, and the linear superposition principle of trigonometric functions, along with function graph transformations and periodicity analysis. Construction highlights: using the Segment command to create auxiliary line segments, defining two sine functions f1 and f2, controlling their parameters via points R1, R2 and objects G1C, G2C, and generating the composite function g = f1 + f2. Additional geometric elements such as tangent lines and orthocenter are included for deeper exploration. This is suitable for high school or early college students learning trigonometry and wave superposition, and serves as an intuitive introduction to Fourier series concepts.
GeoGebra Commands & Parameters
Segment(G2C, G2) → gSegment(G1C, G1) → fSegment(G1, B) → hSegment(G2, B) → i
AI Drawing Prompt Reference
Draw a diagram showing the superposition of two sine functions. Start with two sine curves of different amplitudes and frequencies, each connected by a segment from its peak to a horizontal reference point to highlight parameter control. Then add a third curve representing their sum, displaying the composite waveform. Include a tangent line to the composite curve and mark the orthocenter formed by the tangent and curve intersections for deeper analysis. The layout should clearly show the relationship between individual functions and their sum, along with periodicity and phase changes.
The prompt above was compiled from the original drawing commands and is for reference only.