
Graph of cos(x) with Dynamic Construction
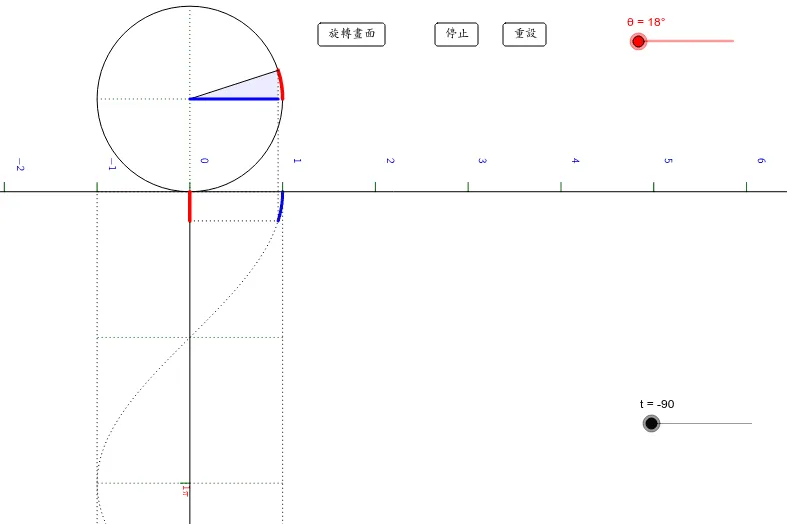
This GeoGebra example demonstrates the graph of the cosine function y = cos(x) through an interactive dynamic construction. It visually links the unit circle, trigonometric lines, and the periodic wave of cosine. Core mathematical concepts include the definition of trigonometric functions, periodicity, transformations of graphs, and the correspondence between angles and coordinates on the unit circle. The construction uses commands such as Circle, Ray, Line, Sequence, PolyLine, CircleArc, Locus, Segment, CurveCartesian, Rotate, Polygon, and If. Key objects include a slider for angle animation, points on the unit circle, and a locus tracing the cosine curve. Suitable for high school and early college students learning trigonometry, as well as for teachers demonstrating the relationship between geometric angles and function graphs. The interactive sliders allow exploration of how the angle affects the cosine value and the shape of the graph.
Loading the math board and drawing, please wait…