
Dynamic Graphing of the Sine Function
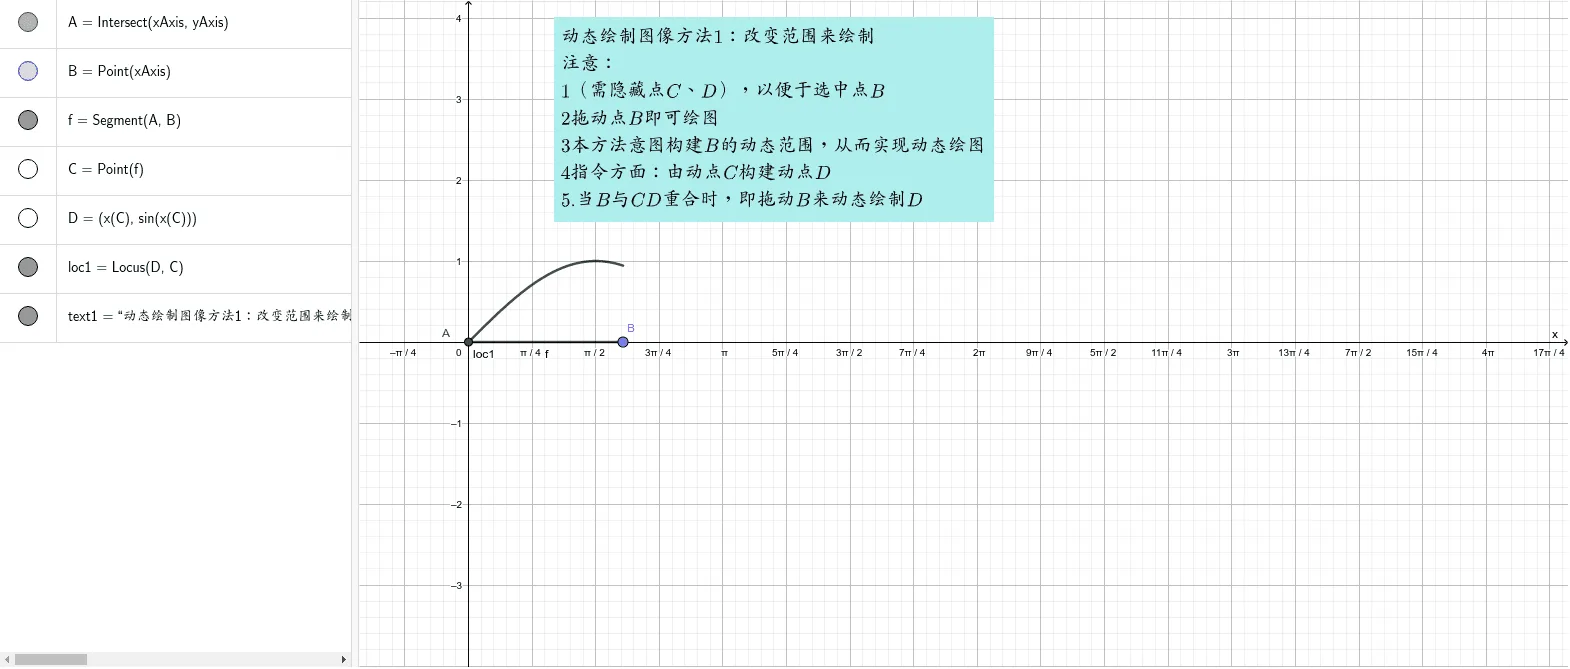
This GeoGebra example demonstrates the dynamic plotting of the sine function as angles vary. Core concepts include trigonometry, sine waves, angle measurement, and locus generation. Construction uses Intersect, Point, Segment, and Locus commands with objects A, B, f, C, D, loc1, and text1 to build the animated path via intersections and segments. Suitable for high school math instruction and function visualization.
Loading the math board and drawing, please wait…