
Generating Tangent Function Graph via Tangent Lines
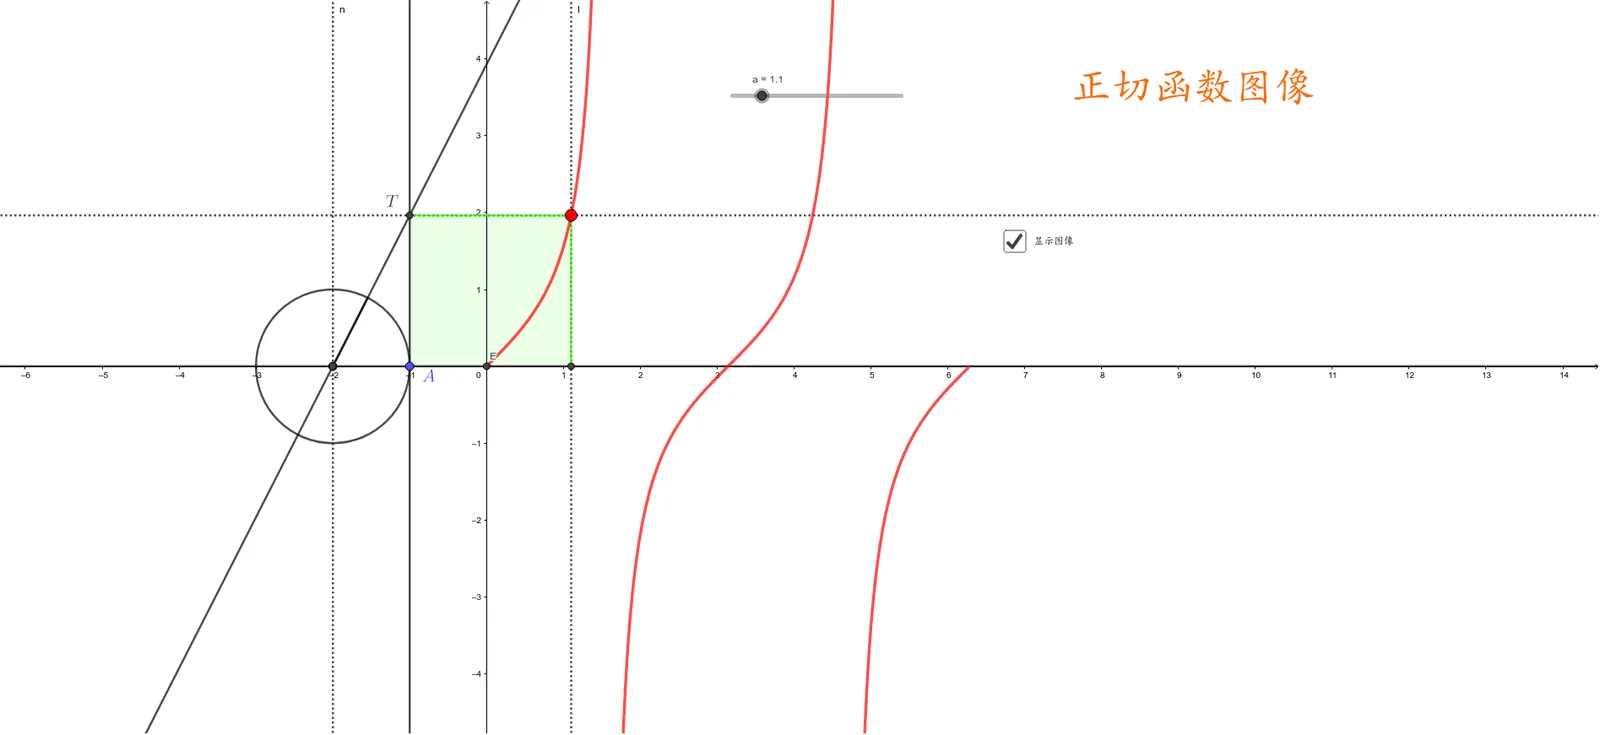
This GeoGebra example demonstrates how tangent lines dynamically produce the graph of the tangent function. Core concepts include trigonometry, tangent definition, parametric curves, angle rotation, and locus equations. Construction uses Circle for unit circle, Intersect for points, Line and OrthogonalLine for tangents, Rotate for angle variation, Segment and Polygon for aids, and Locus to trace points. Ideal for high school trigonometry lessons, parametric equations study, and function visualization to illustrate periodicity and asymptotes.
Loading the math board and drawing, please wait…