
Simple Harmonic Motion Function Graph: Amplitude, Frequency and Phase
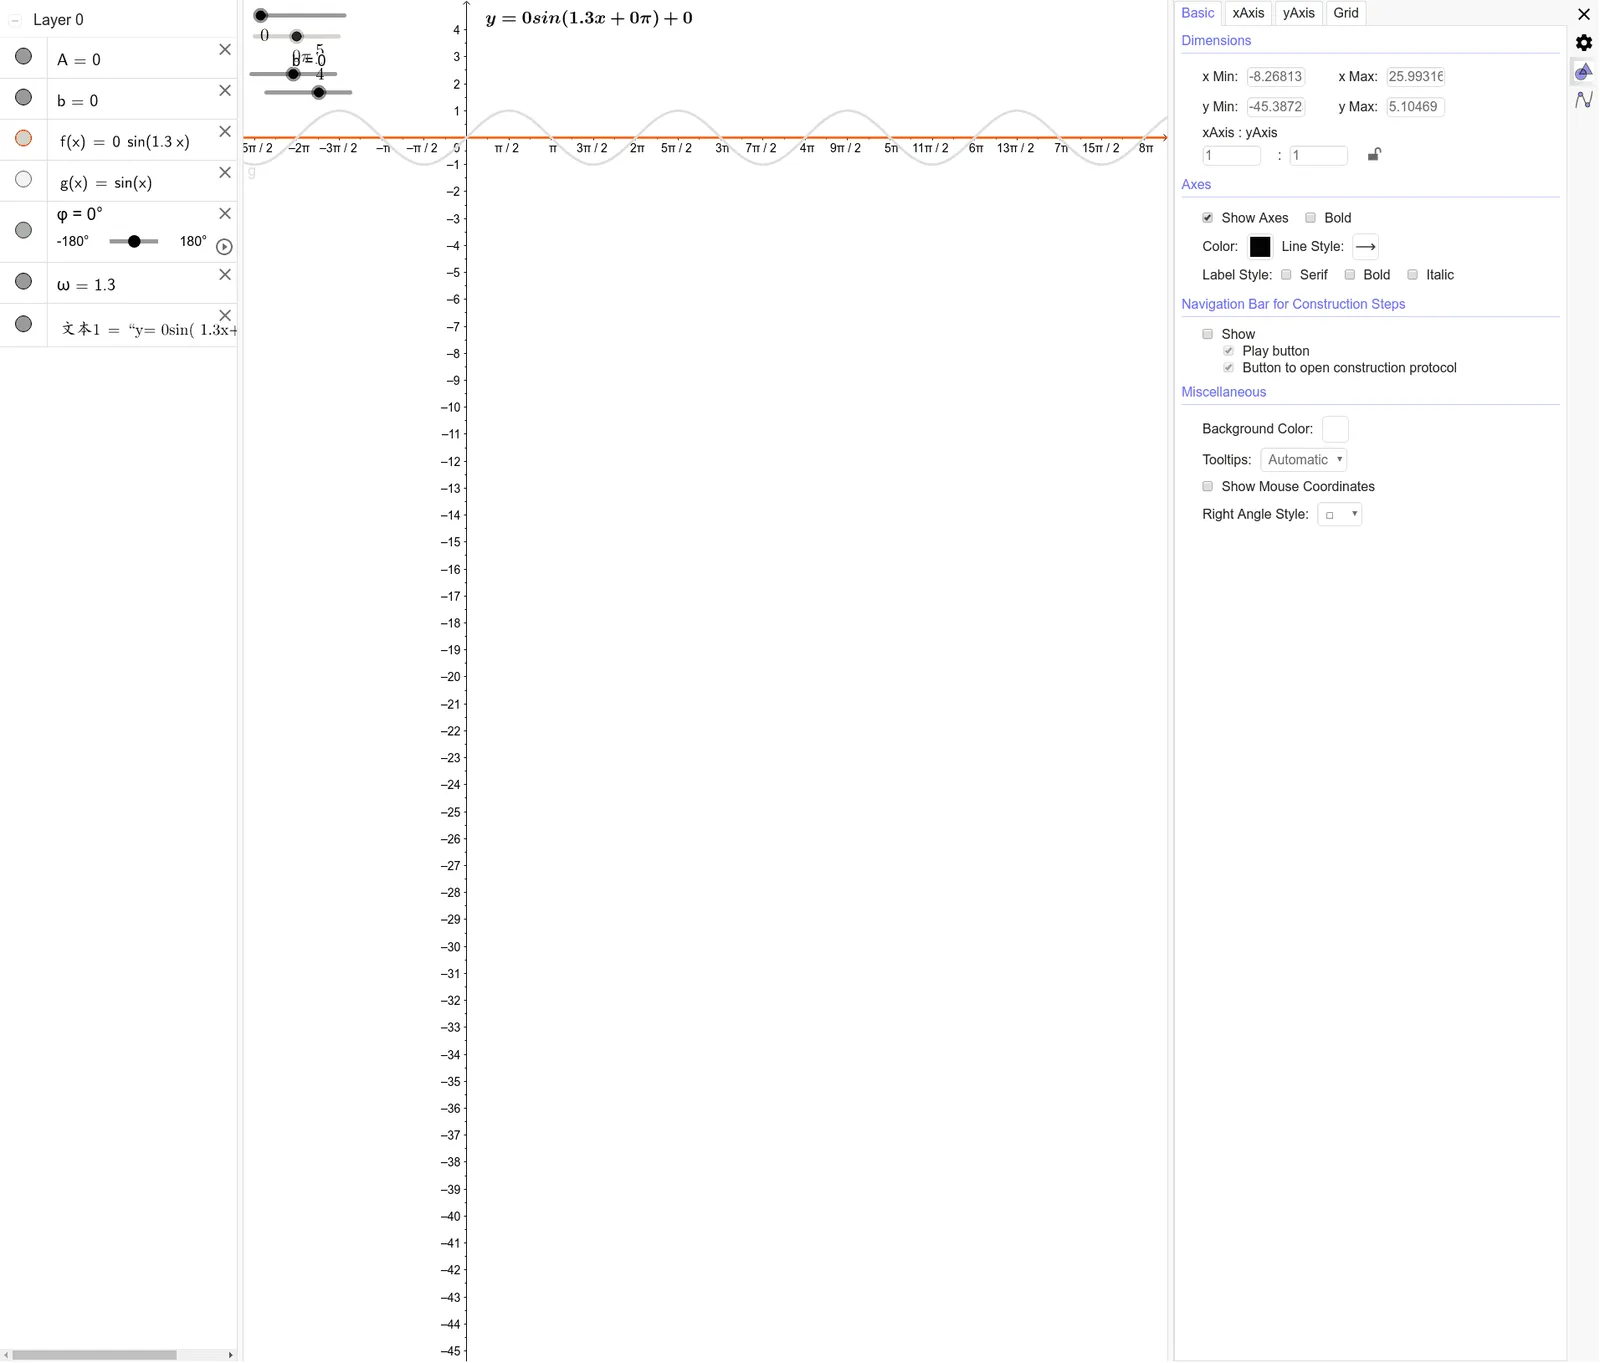
This GeoGebra example dynamically illustrates the simple harmonic motion function y = A·sin(ωx + φ) + b, showing how amplitude, angular frequency, initial phase, and vertical shift affect the waveform. Core mathematical concepts include trigonometric functions, parametric curves, function transformations, and periodicity. The construction uses sliders to control parameters A, ω, b, and φ, defines functions f and g, and includes text objects to display current parameter values for real-time interaction. It is suitable for high school physics and mathematics lessons on simple harmonic motion, wave phenomena, and properties of sinusoidal functions, as well as for pre-university students exploring how parameters transform function graphs. By dragging sliders, learners can observe vertical stretching, horizontal scaling, horizontal shifting, and vertical translation of the wave, deepening their understanding of function graph transformations.
Loading the math board and drawing, please wait…