
Graph and Properties of Sinusoidal Functions
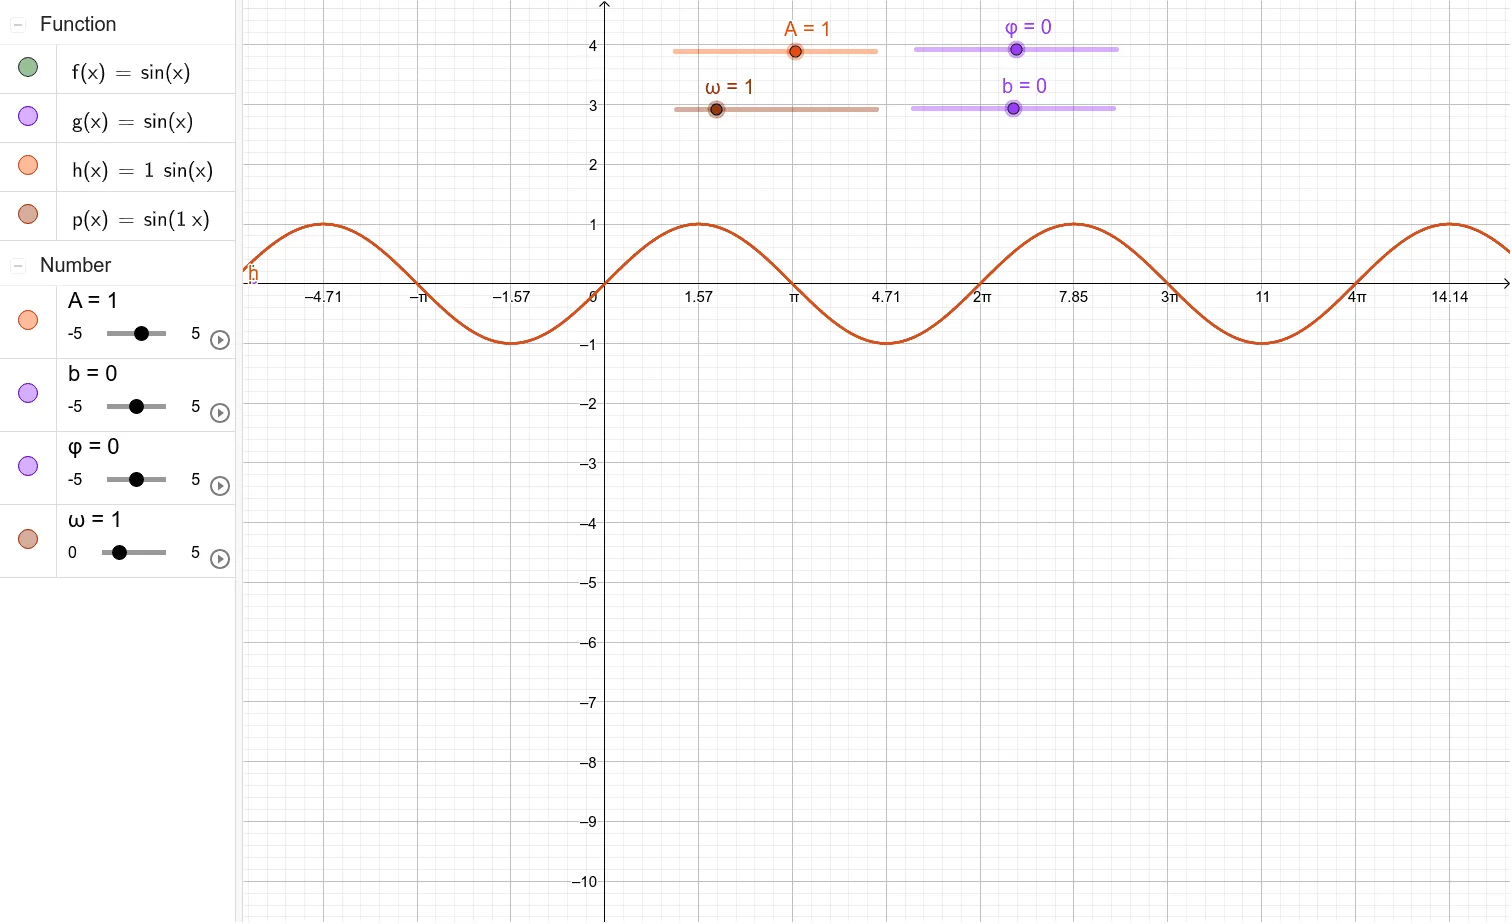
This example demonstrates the graph and properties of sinusoidal functions in the form y=A·sin(ωx+φ)+h. By using sliders to dynamically adjust amplitude A, angular frequency ω, phase shift φ, and vertical displacement h, users can observe how parameter changes affect the function's graph in real-time. Core mathematical concepts include: periodicity of sine functions, amplitude, frequency, phase, and transformation rules of trigonometric graphs. Construction highlights: create parameters A, ω, φ, h using GeoGebra slider tools, define function f(x)=A*sin(ω*x+φ)+h, plot the function graph g, and observe transformations including translation, scaling, and reflection as parameters vary. Suitable for high school trigonometry units and college preparatory math review, enabling students to deeply understand the graphical characteristics and geometric meaning of sinusoidal function parameters through interactive exploration.
Loading the math board and drawing, please wait…