
Plotting Trigonometric Functions by Point Plotting - Changing Parameters Only
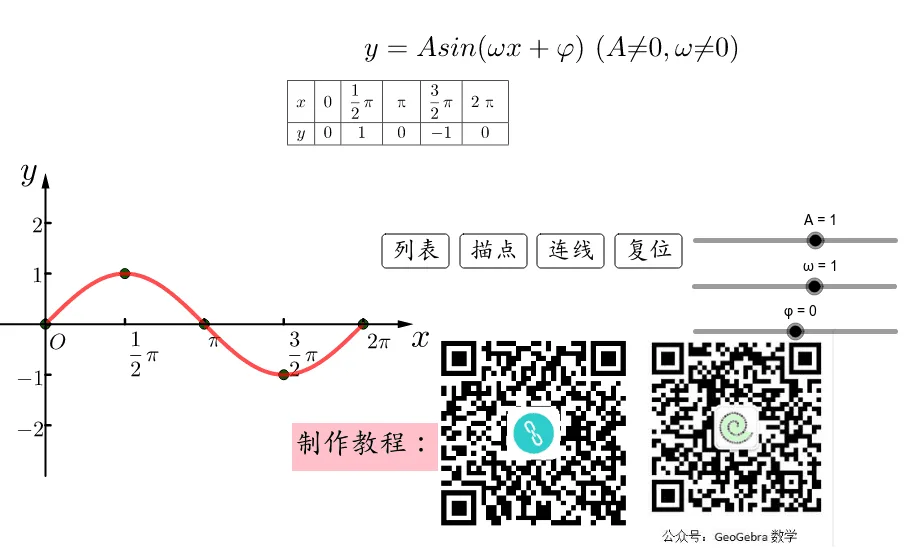
This example demonstrates plotting trigonometric function graphs using the point-plotting method while dynamically altering parameter variables (such as ω, φ, and A) to observe graphical transformations. The core mathematical concepts involve the periodicity, amplitude, and phase shift of trigonometric functions. The construction utilizes GeoGebra commands including Sequence, Flatten, TableText, LaTeX, and coordinate systems, integrated with sliders and buttons for parameter control. It is designed for high school or early college students to visually grasp the properties and parameter effects of trigonometric function graphs.
Loading the math board and drawing, please wait…