
Plotting and Dynamic Demonstration of the Sine Function Graph
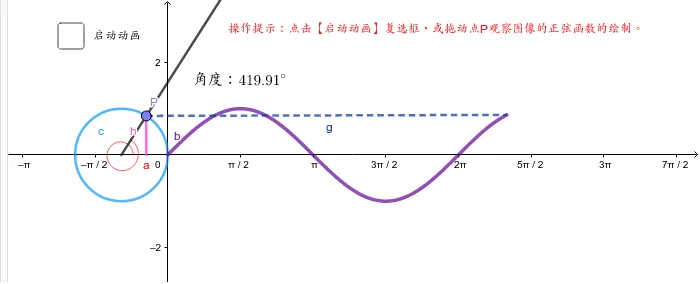
This example demonstrates the plotting process of the sine function graph. Using GeoGebra commands like CurveCartesian, combined with parametric equations and geometric constructions, it dynamically illustrates the generation principle of the sine curve. It includes interactive geometric objects such as points, rays, angles, and segments, helping to intuitively understand the periodicity, amplitude, and phase changes of trigonometric functions, making it suitable for teaching demonstrations on trigonometric functions and function graphs in classroom settings.
In collections
Vocational High School Mathematics
Loading the math board and drawing, please wait…