
Writing Equations of the LSRL from Summary Stats
Loading the math board and drawing, please wait…
In collections
AP Stats Exam Review
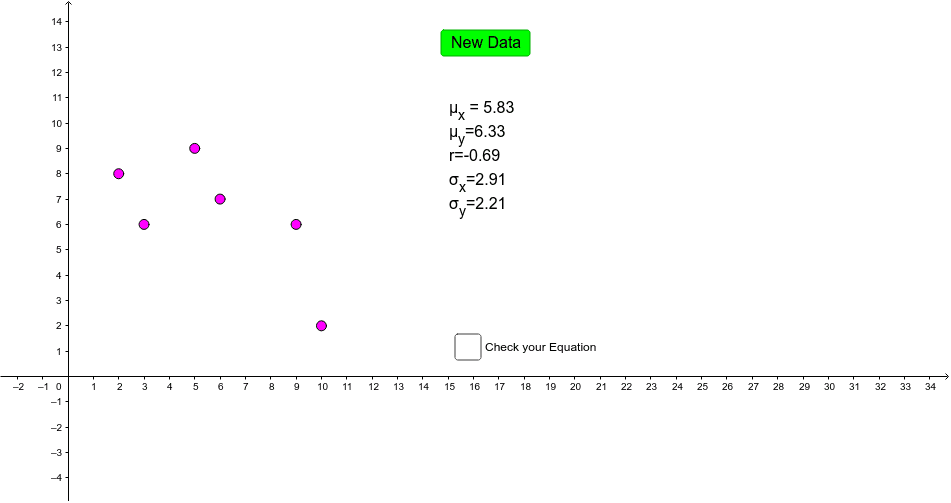
This example demonstrates how to derive and write the equation of the Least Squares Regression Line (LSRL) when only summary statistics of the data points (such as means, standard deviations, and correlation coefficient) are given. The core mathematical concepts include linear regression, Pearson's correlation coefficient (PMCC), mean, standard deviation, and the formulas for the slope and intercept of the regression line. Construction highlights: the GeoGebra commands Random, Sequence, FitLineY, PMCC, Mean, and SD are used to generate random data, build data lists, fit the regression line, compute the correlation coefficient, and calculate the means and standard deviations. Text objects (text1 to text4) dynamically display the calculation steps and the final equation. This example is suitable for high school or introductory college statistics courses, helping students understand the relationship between regression equations and summary statistics and master the method of deriving the regression equation from these statistics.
GeoGebra Commands & Parameters
Random(5, 15) → numSequence(Random[1, 10], a, 1, num) → xlistSequence(Random[1, 10], a, 1, num) → ylistSequence((Element[xlist, a], Element[ylist, a]), a, 1, num) → list1FitLineY(list1) → aPMCC(list1) → rMean(xlist) → muxMean(ylist) → muySD(xlist) → sdxSD(ylist) → sdy
AI Drawing Prompt Reference
Draw a graph showing a least squares regression line. The graph includes a set of randomly generated data points created from two sequences. These points are connected to a fitted line, which represents the regression line. The graph also displays the means and standard deviations of the data points, along with the correlation coefficient. Text labels dynamically show the calculation steps and the final regression equation. The overall graph aims to help understand the process of deriving the regression equation from data summary statistics.
The prompt above was compiled from the original drawing commands and is for reference only.