
Writing Equations from Tables
Loading the math board and drawing, please wait…
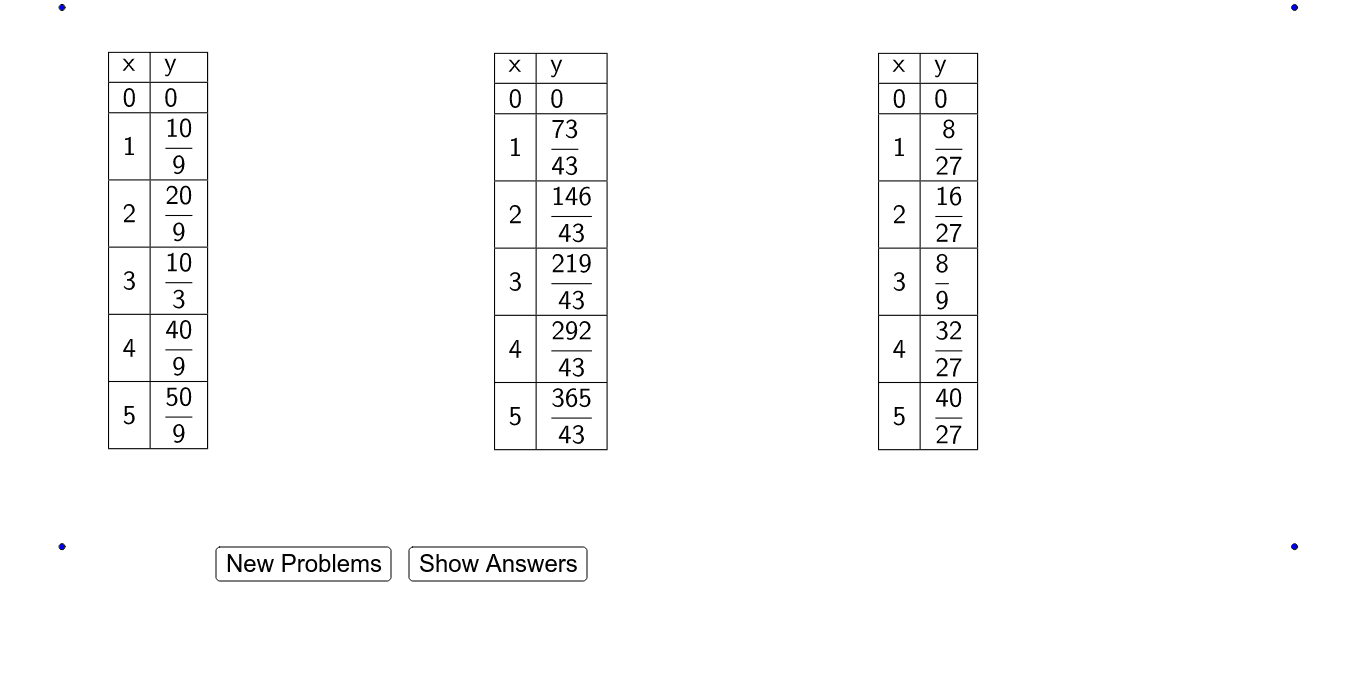
This example demonstrates how to create buttons in GeoGebra to generate random fractions and display them in a table, guiding students to write linear equations representing the data. Key math concepts include equation representation, linear regression, and correlation. Construction highlights the use of commands like Random, If, FractionText, TableText, and objects such as buttons, fractions, and tables. Suitable for middle school and above students learning functions and data analysis.
GeoGebra Commands & Parameters
Random(2, 100) → denominator6Random(2, 100) → denominator5Random(1, (2 * denominator6)) → numerator6Random(2, 100) → denominator4Random(1, (2 * denominator5)) → numerator5Random(2, 100) → denominator1Random(2, 100) → denominator3Random(1, (2 * denominator4)) → numerator4Random(2, 100) → denominator2Random(1, (2 * denominator3)) → numerator3Random(1, (2 * denominator2)) → numerator2Random(1, (2 * denominator1)) → numerator1If(ShowAnswers ≟ true, (("y = " * FractionText[coefficientX1]) * "x"), "y") → yLabel1If(ShowAnswers ≟ true, (("y = " * FractionText[coefficientX2]) * "x"), "y") → yLabel2If(ShowAnswers ≟ true, (("y = " * FractionText[coefficientX3]) * "x"), "y") → yLabel3If(ShowAnswers ≟ true, (("y = " * FractionText[coefficientX4]) * "x"), "y") → yLabel4If(ShowAnswers ≟ true, (("y = " * FractionText[coefficientX5]) * "x"), "y") → yLabel5If(ShowAnswers ≟ true, (("y = " * FractionText[coefficientX6]) * "x"), "y") → yLabel6FractionText((A2 * coefficientX1)) → B2FractionText((A3 * coefficientX1)) → B3FractionText((A4 * coefficientX1)) → B4FractionText((A5 * coefficientX1)) → B5FractionText((A6 * coefficientX1)) → B6FractionText((A7 * coefficientX1)) → B7FractionText((D2 * coefficientX2)) → E2FractionText((D3 * coefficientX2)) → E3FractionText((D4 * coefficientX2)) → E4FractionText((D5 * coefficientX2)) → E5FractionText((D6 * coefficientX2)) → E6FractionText((D7 * coefficientX2)) → E7FractionText((G2 * coefficientX3)) → H2FractionText((G3 * coefficientX3)) → H3FractionText((G4 * coefficientX3)) → H4FractionText((G5 * coefficientX3)) → H5FractionText((G6 * coefficientX3)) → H6FractionText((G7 * coefficientX3)) → H7FractionText((J2 * coefficientX4)) → K2FractionText((J3 * coefficientX4)) → K3FractionText((J4 * coefficientX4)) → K4FractionText((J5 * coefficientX4)) → K5FractionText((J6 * coefficientX4)) → K6FractionText((J7 * coefficientX4)) → K7FractionText((M2 * coefficientX5)) → N2FractionText((M3 * coefficientX5)) → N3FractionText((M4 * coefficientX5)) → N4FractionText((M5 * coefficientX5)) → N5FractionText((M6 * coefficientX5)) → N6FractionText((M7 * coefficientX5)) → N7FractionText((P2 * coefficientX6)) → Q2FractionText((P3 * coefficientX6)) → Q3FractionText((P4 * coefficientX6)) → Q4FractionText((P5 * coefficientX6)) → Q5FractionText((P6 * coefficientX6)) → Q6FractionText((P7 * coefficientX6)) → Q7TableText({{A1, B1}, {A2, B2}, {A3, B3}, {A4, B4}, {A5, B5}, {A6, B6}, {A7, B7}}, "|_") → Table1TableText({{D1, E1}, {D2, E2}, {D3, E3}, {D4, E4}, {D5, E5}, {D6, E6}, {D7, E7}}, "|_") → Table2TableText({{G1, H1}, {G2, H2}, {G3, H3}, {G4, H4}, {G5, H5}, {G6, H6}, {G7, H7}}, "|_") → Table3TableText({{J1, K1}, {J2, K2}, {J3, K3}, {J4, K4}, {J5, K5}, {J6, K6}, {J7, K7}}, "|_") → Table4TableText({{M1, N1}, {M2, N2}, {M3, N3}, {M4, N4}, {M5, N5}, {M6, N6}, {M7, N7}}, "|_") → Table5TableText({{P1, Q1}, {P2, Q2}, {P3, Q3}, {P4, Q4}, {P5, Q5}, {P6, Q6}, {P7, Q7}}, "|_") → Table6
AI Drawing Prompt Reference
Create an interactive graph showing how to write linear equations from table data. Include randomly generated fraction pairs displayed in a table, guiding users to observe data patterns. Use buttons to generate new fraction pairs, plot data points in different colors, and draw corresponding linear regression lines. Display the linear equation for each data set, with coefficients as fractions. The graph should have a data display area, equation display area, and an operation button area, generating data points first, then fitting regression lines, and finally showing equations.
The prompt above was compiled from the original drawing commands and is for reference only.