
Weird Function Demonstration
Loading the math board and drawing, please wait…
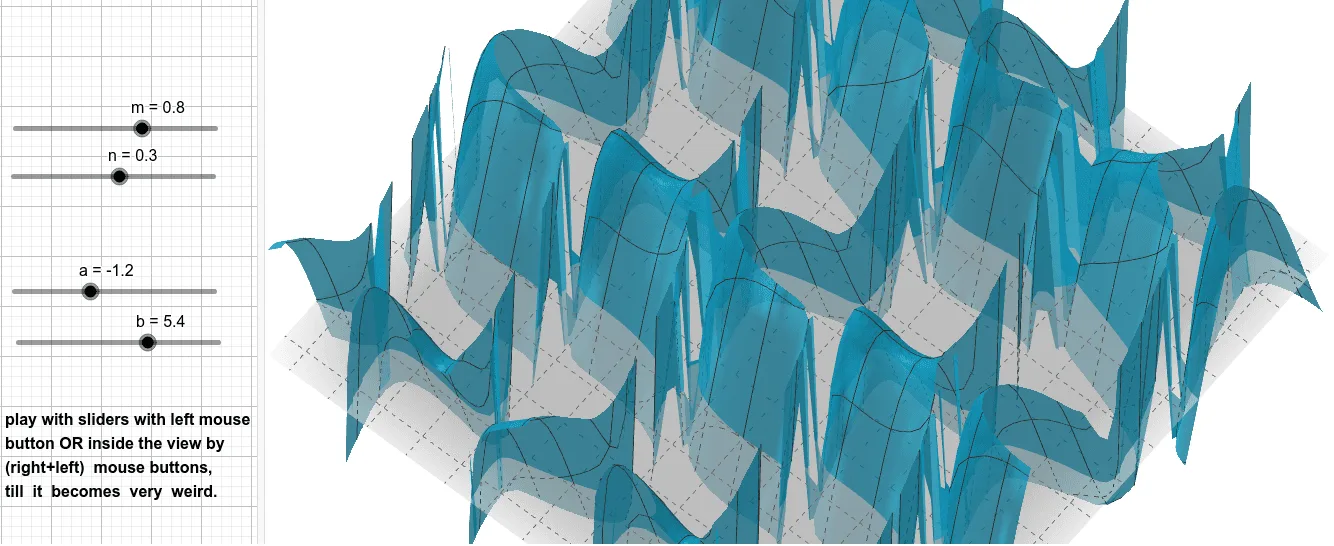
This example demonstrates the dynamic process of observing function graphs and geometric transformations by adjusting parameters m, b, a, n, H, etc. Core mathematical concepts include function graphs, geometric transformations, polynomial functions, geometric mean, volume calculation, etc. It uses GeoGebra commands/objects: objects m, b, text2, a, n, H. Suitable for high school and above mathematics learners and teachers to explore function properties and geometric transformations.
GeoGebra Commands & Parameters
Numeric m(0.8)Numeric b(5.4)Numeric a(-1.2)Numeric n(0.3)H(x, y) = (a * sin(x + b)) + (b * cos(y + a)) + ((m + a) * tan(x + (n * y)))
AI Drawing Prompt Reference
Draw a dynamic function graph to demonstrate the effect of parameters m, b, a, n, H on the function graph and geometric transformations. Start by plotting the base function graph, then observe how adjusting the values of m, b, a, n changes the shape and position of the function. Pay special attention to the complex function defined by H, which combines sine, cosine, and tangent functions, showcasing rich geometric transformation effects.
The prompt above was compiled from the original drawing commands and is for reference only.