
Wave Example
Loading the math board and drawing, please wait…
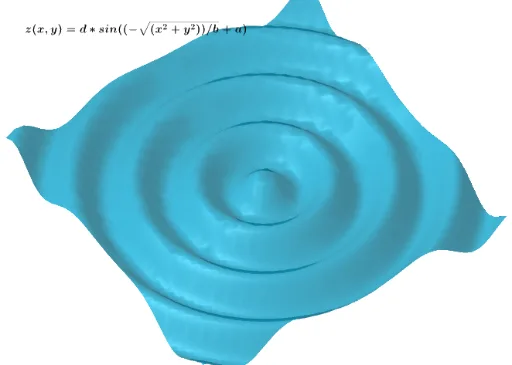
This example demonstrates the mathematical model of wave patterns and their dynamic behavior. It involves core concepts like trigonometric functions, statistical properties, function graphing, 3D shape visualization, and parameter manipulation. Construction highlights the use of GeoGebra objects a, b, d, c, text1, potentially including slider animations and locus plotting. Suitable for high school mathematics students and educators for teaching function graphs, trigonometric applications, and 3D geometry visualization.
GeoGebra Commands & Parameters
Numeric a(2.1)Numeric b(2.4)Numeric d(4)c(x, y) = (d * sin(((-sqrt(x^(2) + y^(2)))) / b + a))
AI Drawing Prompt Reference
Draw a mathematical model showing wave patterns using a sine function to generate 3D waveforms, with sliders to dynamically adjust parameters, displaying statistical properties and 3D shapes of the waves, and labeling key parameter values.
The prompt above was compiled from the original drawing commands and is for reference only.