
Voronoi Diagram (1): Constructing Thiessen Polygons from Point Sets
Loading the math board and drawing, please wait…
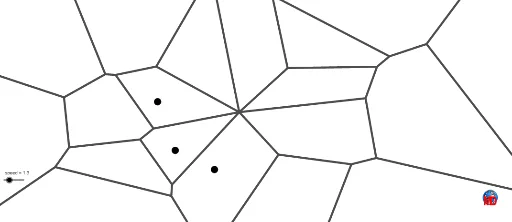
This example demonstrates how to construct a Voronoi diagram (Thiessen polygons) from a set of discrete points, partitioning the plane into regions where each point is closest to a given seed. The core mathematical concepts include computational geometry, Voronoi tessellation, distance metrics, and polygonal region generation. Construction highlights: using GeoGebra commands such as Circle, Point, and Voronoi, defining multiple seed points (e.g., A, B, C, etc.), invoking the Voronoi command to automatically generate region boundaries, and adding auxiliary circles and lines (e.g., l1, graphe1) to visualize distance relationships. Suitable for high school or university students learning computational geometry, spatial partitioning, or GIS fundamentals, as well as for mathematical modeling or competition training, providing an intuitive understanding of nearest-neighbor principles and geometric region division.
GeoGebra Commands & Parameters
Circle(A, B) → cPoint(c) → TPoint(c) → FPoint(c) → EPoint(c) → DPoint(c) → CPoint(c) → MVoronoi(l1) → graphe1