
Visualizing Upper and Lower Riemann Sums
Loading the math board and drawing, please wait…
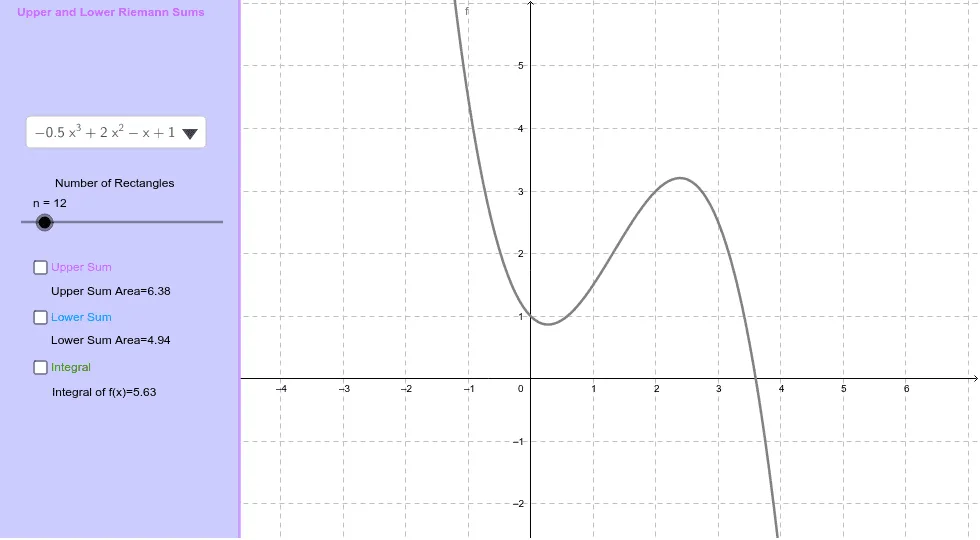
This GeoGebra example dynamically illustrates the upper and lower Riemann sums for a selected function over a given interval, alongside the exact definite integral value, enabling students to intuitively grasp how Riemann sums approximate the integral as the partition refines. Core mathematical concepts include Riemann sums, definite integrals, interval partitioning, function graphing, and the idea of limits. Construction highlights: the SelectedElement command picks the function, UpperSum and LowerSum generate the upper and lower rectangle sums, Integral computes the exact area, and CreatePanel builds an interactive control panel; key objects include function f, endpoints A and B, partition number n, rectangle sum objects UpperSum_1 and LowerSum_1, text labels text1–text5, and polygon poly1. Suitable for high school and early college calculus learners, this resource supports classroom demonstrations or self-study, allowing users to adjust slider n to observe how the upper and lower sums converge to the integral value as the number of subintervals increases.
GeoGebra Commands & Parameters
SelectedElement(Function) → fUpperSum(f, x(A), x(B), n) → UpperSum_1LowerSum(f, x(A), x(B), n) → LowerSum_1Integral(f, x(A), x(B)) → Integral_1CreatePanel(240) → poly1, a
AI Drawing Prompt Reference
Draw the upper and lower Riemann sums of function f over the interval [A, B], and observe how they approximate the definite integral value as you adjust the partition number n. First, select function f, then calculate the upper and lower Riemann sums as UpperSum_1 and LowerSum_1, followed by computing the exact integral value as Integral_1, and finally add an interactive control panel as poly1 to adjust n.
The prompt above was compiled from the original drawing commands and is for reference only.