
Intuitive Concept of Limits by hpp3
Loading the math board and drawing, please wait…
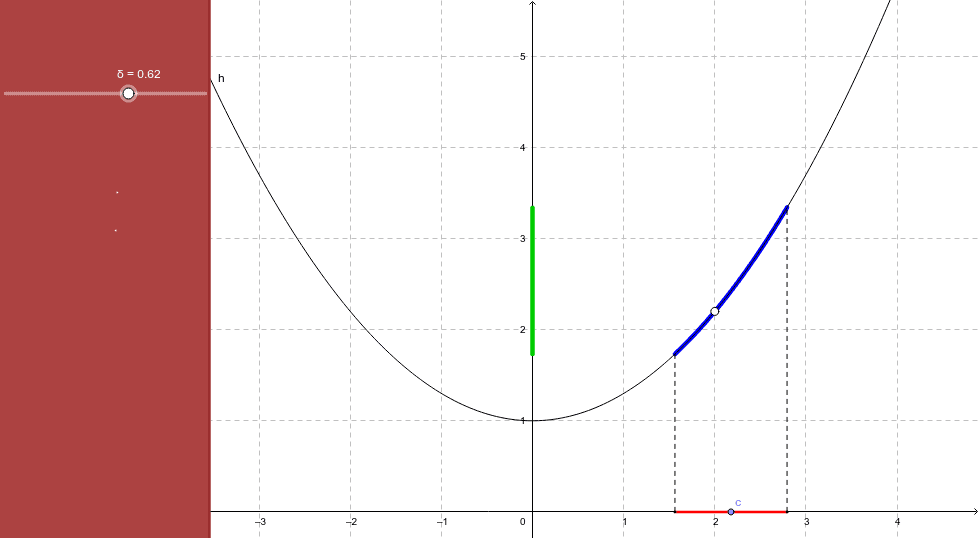
This example demonstrates the intuitive concept of limits through dynamic graphics. It shows the behavior of function values as the variable approaches a certain point, involving the core mathematical concept of limits. Construction highlights include using commands like Point, Segment, Function, Locus, CreatePanel in GeoGebra; suitable for high school or introductory college calculus students.
GeoGebra Commands & Parameters
Point(xAxis) → ASegment(L, R) → δsegFunction(h, a, b) → gPoint(Segment[L, R]) → PLocus(Q, P) → rangeSegment(L, (a, h(a))) → dashLeftSegment(R, (b, h(b))) → dashRightCreatePanel(210) → poly1, e
AI Drawing Prompt Reference
Draw the graph of a function g(x) where g(x) = h(x). Set points A and B on the x-axis, and draw a segment δseg between them. On δseg, place a point P to show how the function values change as x approaches A or B. Draw the tangents dashLeft and dashRight at points A and B for the function h(x) to illustrate the limit behavior. Finally, create a panel poly1 to display these graphics.
The prompt above was compiled from the original drawing commands and is for reference only.