
Visualizing Polynomial Roots
Loading the math board and drawing, please wait…
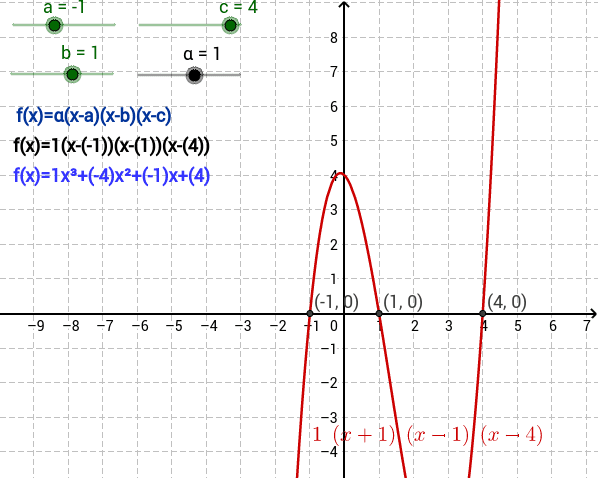
① This applet plots a cubic polynomial with three real roots and highlights the intersection points with the x‑axis, demonstrating what a polynomial root looks like on a graph. ② Core mathematical concepts include polynomial functions, definition of real roots, the geometric meaning of function zeros, and the continuity principle. ③ Construction highlights: the Intersect command finds the graph‑axis intersections; sliders control coefficients a, b, c, p, dynamically updating objects α, A, B, C, A1, B1, C1, D1 and text labels texto1, text2, text3. ④ Suitable for high‑school algebra and analytic geometry lessons, as well as college‑prep review of polynomial root visualization.
GeoGebra Commands & Parameters
Intersect(p, xAxis) → A, B, C
AI Drawing Prompt Reference
Draw the graph of a cubic polynomial function that intersects the x-axis at three distinct points, highlighting these intersection points to visualize polynomial roots. Use sliders to control the coefficients of the polynomial, allowing the graph to dynamically update as the coefficients change. Include text labels to explain the significance of each intersection point and illustrate the relationship between polynomial roots and function zeros, as well as the continuity principle as demonstrated in the graph.
The prompt above was compiled from the original drawing commands and is for reference only.