
Visualizing Polynomial Roots and Complex Roots
Loading the math board and drawing, please wait…
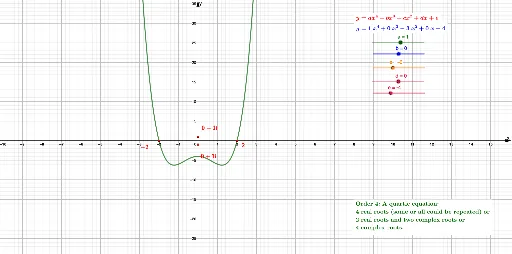
This GeoGebra example dynamically displays the roots of a polynomial (both real and complex) on the complex plane, using equilateral triangles and ratios to aid understanding of root-coefficient relationships. Core mathematical concepts include polynomial root-finding, complex number representation, Vieta's formulas, and the geometric interpretation of roots. Construction highlights: the Root command computes real roots, ComplexRoot computes complex roots, and SurdText displays roots in radical form; objects include the polynomial function f, root points Root_1 to Root_4, complex points z_1 to z_6 with text labels, and auxiliary segments/triangles (g, h, i, j, p). Suitable for high school and above in algebra, complex numbers, or math lab activities, allowing students to observe how roots change as polynomial coefficients vary.
GeoGebra Commands & Parameters
Root(f) → A, B, C, DSurdText(g) → Root_1SurdText(h) → Root_2SurdText(i) → Root_3SurdText(j) → Root_4ComplexRoot(f) → z_1, z_2, z_3, z_4SurdText(z_1) → textz_1SurdText(z_2) → textz_2SurdText(z_3) → textz_3SurdText(z_4) → textz_4ComplexRoot(p) → z_5, z_6, z_7SurdText(z_5) → textz_5SurdText(z_6) → textz_6SurdText(z_7) → textz_7ComplexRoot(q) → z_8, z_9SurdText(z_8) → textz_8SurdText(z_9) → textz_9
AI Drawing Prompt Reference
Create a dynamic visualization of polynomial roots. Start by defining a polynomial function and marking all its real and complex roots on the complex plane. Each root should be accompanied by a text label displaying its value in radical form. Additionally, compute and label the complex roots for two other auxiliary polynomials. The construction should focus on the spatial distribution of these root points and their corresponding mathematical expressions, allowing for the observation of how both real and complex roots shift as coefficients vary.
The prompt above was compiled from the original drawing commands and is for reference only.