
Visualizing Measures of Center
Loading the math board and drawing, please wait…
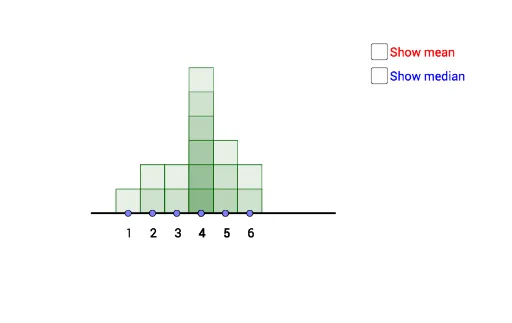
This activity allows students to directly manipulate a data set to observe and understand the changes in mean and median. Key mathematical concepts include mean and median. GeoGebra commands used include Segment, Point, Line, Frequency, Mode, and Sequence. Suitable for middle school and above students to learn about measures of center.
GeoGebra Commands & Parameters
Segment((0, 0), (9, 0)) → gPoint(g) → MPoint(g) → QPoint(g) → NPoint(g) → LPoint(g) → KPoint(g) → PPoint(g) → CPoint(g) → DPoint(g) → EPoint(g) → FPoint(g) → GPoint(g) → HPoint(g) → IPoint(g) → JPoint(g) → RPoint(g) → OLine(A, B) → fFrequency(list4, list1) → list5Segment((-0.5, 0), (9.5, 0)) → iMode(list1) → list3Mode(list1) → list6Sequence(Sequence[Polygon[(n - 0.5, 0), (n - 0.5, k), (n + 0.5, k), (n + 0.5, 0)], k, 1, Element[list5, n + 1], 1], n, 0, 9, 1) → list2
AI Drawing Prompt Reference
Draw a horizontal line segment of length 9 units, then place 10 points on the segment. Draw a line through the first two points. Use these 10 points as a dataset to calculate and plot the frequency histogram, mark the mode of the dataset, and represent each interval of the histogram with a polygon.
The prompt above was compiled from the original drawing commands and is for reference only.