
Visualizing Function Transformations af(b(x-c))+d
Loading the math board and drawing, please wait…
In collections
Grade 12 PreCalculus BC
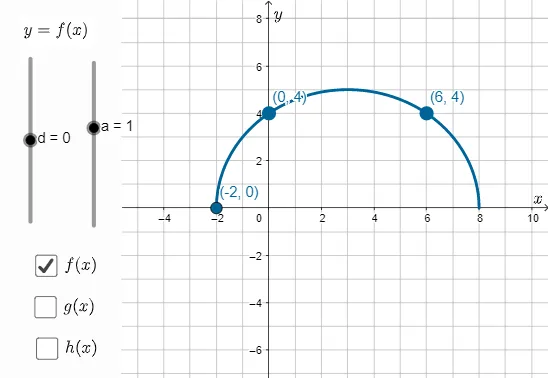
This GeoGebra example features three interactive applets that systematically demonstrate the complete transformation of a function y = af(b(x-c))+d, covering vertical scaling, horizontal scaling, horizontal shift, and vertical shift. The core mathematical concept is affine transformations of function graphs, including amplitude changes, period changes, and the effect of translations on graph position. The construction uses GeoGebra's If command and slider objects (such as a, b, c, d) to dynamically control parameters, along with auxiliary functions and text labels (like atext, dtext) to display the transformation formula in real time. Suitable for high school and above in the unit of function transformations, this resource serves as an interactive tool for classroom demonstrations or student self-exploration, helping learners intuitively grasp how parameter changes jointly affect the shape and position of function graphs.
GeoGebra Commands & Parameters
If(a ≟ 1, "", If[a ≟ -1, "-", Text[a]]) → atextIf(d ≟ 0, "", If[d < 0, Text[d], ("+" * Text[d])]) → dtext
AI Drawing Prompt Reference
Draw the graph of the function y=af(b(x-c))+d, where a, b, c, and d are adjustable parameters. Start with the basic function y=x, then use sliders to adjust a for vertical scaling, b for horizontal scaling, c for horizontal shift, and d for vertical shift. Display the current parameter values and transformation formula on the graph.
The prompt above was compiled from the original drawing commands and is for reference only.