
Visualize Measures of Center and Spread
Loading the math board and drawing, please wait…
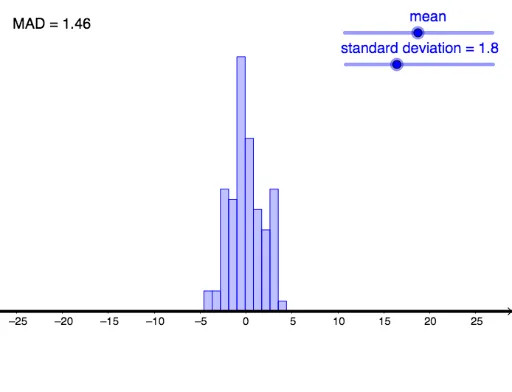
This activity uses a randomly generated histogram to help students visualize measures of center and spread. Key mathematical concepts include mean and standard deviation. Using GeoGebra commands like Sequence, Histogram, mean, and standarddeviation, students can dynamically observe changes in data distribution. Suitable for middle school and above students learning statistics.
GeoGebra Commands & Parameters
Sequence(InverseNormal[mean1, standarddeviation1, random()], n, 0, 99) → NumbersSequence(mean1 + (n * standarddeviation1 / 2), n, -10, 10, 1) → BoundariesHistogram(Boundaries, Numbers) → VisualSequence(abs(Numbers(n) - mean1), n, 1, Length[Numbers]) → AbsoluteDeviationsmean(AbsoluteDeviations) → mad
AI Drawing Prompt Reference
Create a histogram of a randomly generated dataset to visualize its distribution. First, generate a sequence of random numbers, then calculate the mean and standard deviation of these numbers. Use these values to draw the histogram, and compute the absolute deviations of each data point from the mean. Finally, calculate the mean of these absolute deviations.
The prompt above was compiled from the original drawing commands and is for reference only.