
Visualize Measures of Center and Spread (Box Plot)
Loading the math board and drawing, please wait…
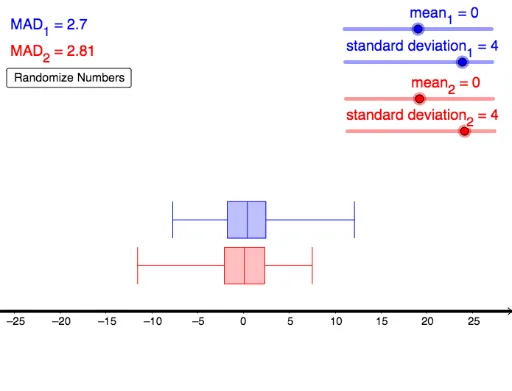
① This activity demonstrates how measures of center (mean) and spread (standard deviation, mean absolute deviation) affect the appearance of two randomly generated box plots. ② Core mathematical concepts include statistical characteristics such as mean, standard deviation, mean absolute deviation, and the construction of box plots based on quartiles and extremes. ③ Construction details: The GeoGebra commands Sequence, mean, and BoxPlot are used to generate random data, compute means, and draw box plots. Objects like mean1, standarddeviation1, Numbers1, Boundaries1, AbsoluteDeviations1, mad1, text1, mean2, standarddeviation2, Numbers2, Boundaries2, AbsoluteDeviations2, mad2, text2, button1, Visual1, and Visual2 are created to enable interactive exploration, allowing users to adjust parameters and observe changes in the plots. ④ Suitable for middle or high school statistics lessons, this tool helps students grasp the intuitive meaning of central tendency and dispersion, and how different statistical measures influence the shape of box plots.
GeoGebra Commands & Parameters
Sequence(InverseNormal[mean1, standarddeviation1, random()], n, 0, 99) → Numbers1Sequence(mean1 + (n * standarddeviation1 / 2), n, -10, 10, 1) → Boundaries1Sequence(abs(Numbers1(n) - mean1), n, 1, Length[Numbers1]) → AbsoluteDeviations1mean(AbsoluteDeviations1) → mad1Sequence(InverseNormal[mean2, standarddeviation2, random()], n, 0, 99) → Numbers2Sequence(mean2 + (n * standarddeviation2 / 2), n, -10, 10, 1) → Boundaries2Sequence(abs(Numbers2(n) - mean2), n, 1, Length[Numbers2]) → AbsoluteDeviations2mean(AbsoluteDeviations2) → mad2BoxPlot(10, 2, Numbers1) → Visual1BoxPlot(5, 2, Numbers2) → Visual2