
Visual Solving of Absolute Value Inequalities (Greater Than)
Loading the math board and drawing, please wait…
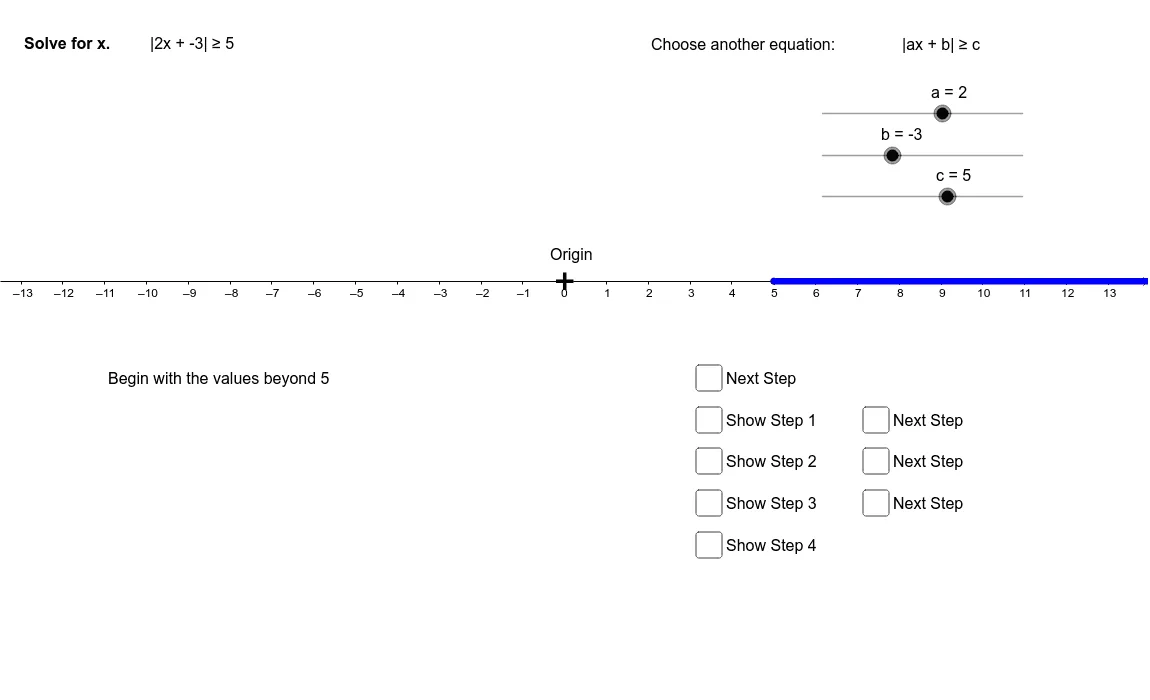
This example shows a step‑by‑step visual method for solving absolute value inequalities of the form |x| > a. It covers the key concepts of absolute value functions, inequality solution sets, and interval representation on the number line. Construction uses the Ray command to draw rays for solution intervals, Textfield for interactive parameter entry, and numerous point and text objects (A, B, C … text1, text2 …) to label coordinates and procedural steps. Suitable for middle‑ and high‑school algebra instruction, self‑study, and teacher‑created lesson materials.
GeoGebra Commands & Parameters
Ray(C, I) → pRay(B, J) → hRay(D, K) → iRay(E, L) → jRay(F, M) → gRay(G, N) → qRay(F, (x(F) + 1, 0)) → g_1Ray(G, (x(G) - 1, 0)) → q_1Textfield(a) → inputBox1
AI Drawing Prompt Reference
Draw a number line to illustrate the solution set of an absolute value inequality |x| > a, where a is a positive number. Mark the origin and several key points on the line. From these points, draw rays extending to the right or left to represent the solution intervals (e.g., a ray starting at a point and going right, another ray starting at another point and going left). Place an interactive input box near the line for entering the value of a. Include multiple labeled points to indicate coordinates and procedural steps, creating a clear visual teaching aid for solving such inequalities.
The prompt above was compiled from the original drawing commands and is for reference only.