
Exploring Side Lengths of a Rectangle with Fixed Area
Loading the math board and drawing, please wait…
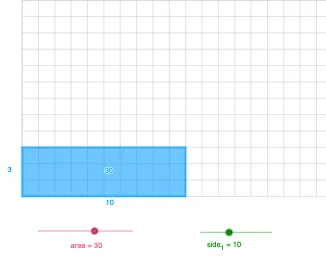
This GeoGebra example dynamically demonstrates the inverse relationship between the two side lengths of a rectangle when its area is held constant. The core mathematical concepts include the area formula (Area = length × width), functional dependence between variables, and elements of algebra, geometry, and hypothesis testing in statistics. The construction uses GeoGebra commands such as Polygon to create rectangle ABCD, PointIn to place draggable points inside or on the rectangle, and slider or text objects (e.g., side_1, side_2, area) to display changing side lengths and area values. It may also incorporate sine functions or straight lines to further analyze the variation pattern. This resource is suitable for middle school to high school students, helping them understand inverse proportional relationships, variable dependency, and the connection between geometry and algebra. It serves well for inquiry-based learning or classroom demonstrations.
GeoGebra Commands & Parameters
Polygon(A, B, C, D) → q1, a_1, b, c, dPointIn(q1) → Pointq1
AI Drawing Prompt Reference
Draw a rectangle on a coordinate plane by defining four corner points and connecting them to form the rectangle outline. Then place a point inside the rectangle (allowing it to be on the boundary as well), representing a draggable point within the rectangular region. Arrange the construction so viewers can observe how the rectangle’s side lengths relate under a fixed-area constraint. Build it in order: first the rectangle, then the internal point.
The prompt above was compiled from the original drawing commands and is for reference only.