
US Cases and Deaths of Covid-19 Since 3/15/2020
Loading the math board and drawing, please wait…
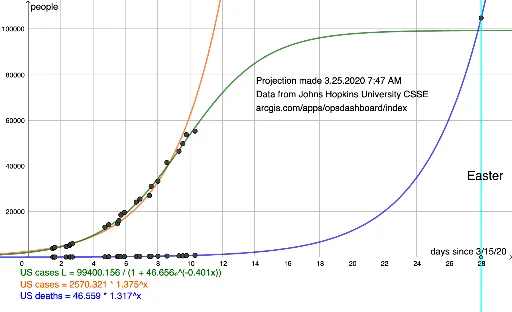
This example visualizes the US cases and deaths of COVID-19 since March 15, 2020, using data from Johns Hopkins University. It involves statistical analysis and exponential functions. GeoGebra commands such as FitGrowth and FitLogistic are used to analyze the growth trends. Suitable for high school and above students or researchers.
GeoGebra Commands & Parameters
FitGrowth(l1) → fFitGrowth(l2) → gFitLogistic(l2) → hFitLogistic(l1) → pOrthogonalLine(W_1, xAxis) → iIntersect(f, i, (28, 104836.39346112047)) → Z_1
AI Drawing Prompt Reference
Create a statistical chart showing US COVID-19 cases and deaths since March 15, 2020. Plot two data curves: one for cumulative confirmed cases and one for cumulative deaths, both increasing over time. For each curve, fit an exponential growth trend line. Additionally, fit a logistic growth curve to the death data to show its saturation trend. Draw a vertical line at a specific point on the time axis, and mark its intersection with the exponential fit of the cases curve, indicating the corresponding value. The chart should clearly display raw data points, multiple fitted curves, and the key intersection point for analyzing the pandemic progression.
The prompt above was compiled from the original drawing commands and is for reference only.