
Visual Percentages
Loading the math board and drawing, please wait…
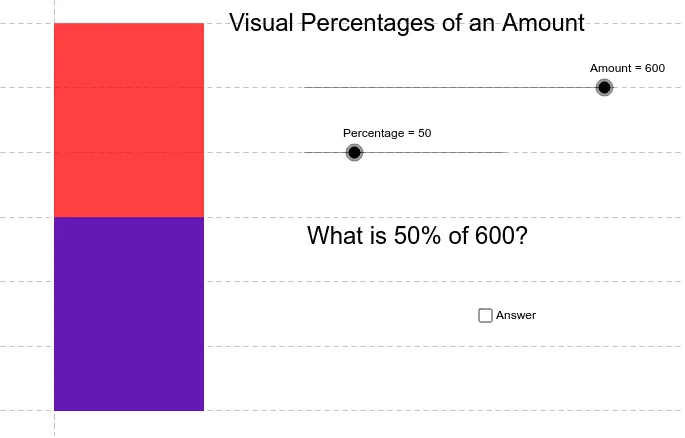
This example visually demonstrates the concept of percentages. It involves mathematical concepts such as percentages, expected value, mode, subtraction, and tangents. Using GeoGebra commands like Polygon, Amount, and Percentage, users can intuitively understand these concepts. Suitable for middle school and above students and teachers.
GeoGebra Commands & Parameters
Polygon(A, B, C, D) → poly1, a, b, c, dPolygon(E, F, H, G) → poly2, e, f, h, g
AI Drawing Prompt Reference
Draw two quadrilaterals on the canvas, where the first quadrilateral represents the whole or total amount, and the second represents a portion or subset. Adjust their relative sizes and positions to visually demonstrate percentage or probability concepts, such as one shape containing another or showing a specific proportional relationship. This geometric construction can be used to intuitively explain ratios, probabilities, and statistical distributions.
The prompt above was compiled from the original drawing commands and is for reference only.