
Venn Diagrams with Circles: Visualizing Intersections and Unions
Loading the math board and drawing, please wait…
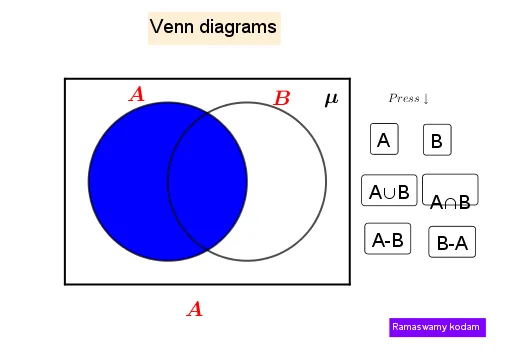
This example demonstrates how Venn diagrams can be built in GeoGebra by drawing intersecting circles so that different regions correspond to different set components (exclusive parts, intersection, and union). The key mathematics is set theory—set operations such as intersection and union—realized visually through the geometry of circle overlaps. Construction focuses on: creating circles with Circle; finding intersection points using Intersect; and using geometric helpers such as Line and Segment to shape boundaries and guide layout. Depending on the diagram details, it also leverages tools like OrthogonalLine and Tangent for auxiliary constructions related to circle geometry, while Polygon helps outline regions and CircleSector can present arc-based components. The result is well-suited for classroom demonstrations in upper secondary school through early university, supporting intuitive understanding of abstract set relationships and strengthening geometry-based reasoning.
GeoGebra Commands & Parameters
Circle(A, B) → cCircle(B, A) → dSegment(A, B) → fCircle(A, f + 0.6) → eCircle(B, f + 0.6) → gOrthogonalLine(A, f) → hIntersect(e, h) → C, DIntersect(c, d) → E, F, ,Tangent(D, e) → i,Tangent(C, e) → j,Line(A, B) → kIntersect(e, k) → G, HIntersect(g, k) → I, JOrthogonalLine(G, f) → lOrthogonalLine(J, k) → mIntersect(m, i) → KIntersect(l, i) → LIntersect(j, l) → MIntersect(m, j) → NPolygon(M, N, K, L) → q1, m_1, n, k_1, l_1CircleSector(B, E, F) → pCircleSector(A, F, E) → qMidpoint(B, K) → OMidpoint(O, K) → PCircle(A, B) → rCircle(B, A) → sPoint(r) → QPoint(s) → R
AI Drawing Prompt Reference
Draw a Venn diagram using two intersecting circles. The circles create four regions: two independent outer areas, an overlapping intersection area, and a union area. Use lines and segments to define boundaries clearly. Add auxiliary lines to guide the layout, making the diagram suitable for teaching demonstrations.
The prompt above was compiled from the original drawing commands and is for reference only.