
Venn Diagram Set Operations Self-Test
Loading the math board and drawing, please wait…
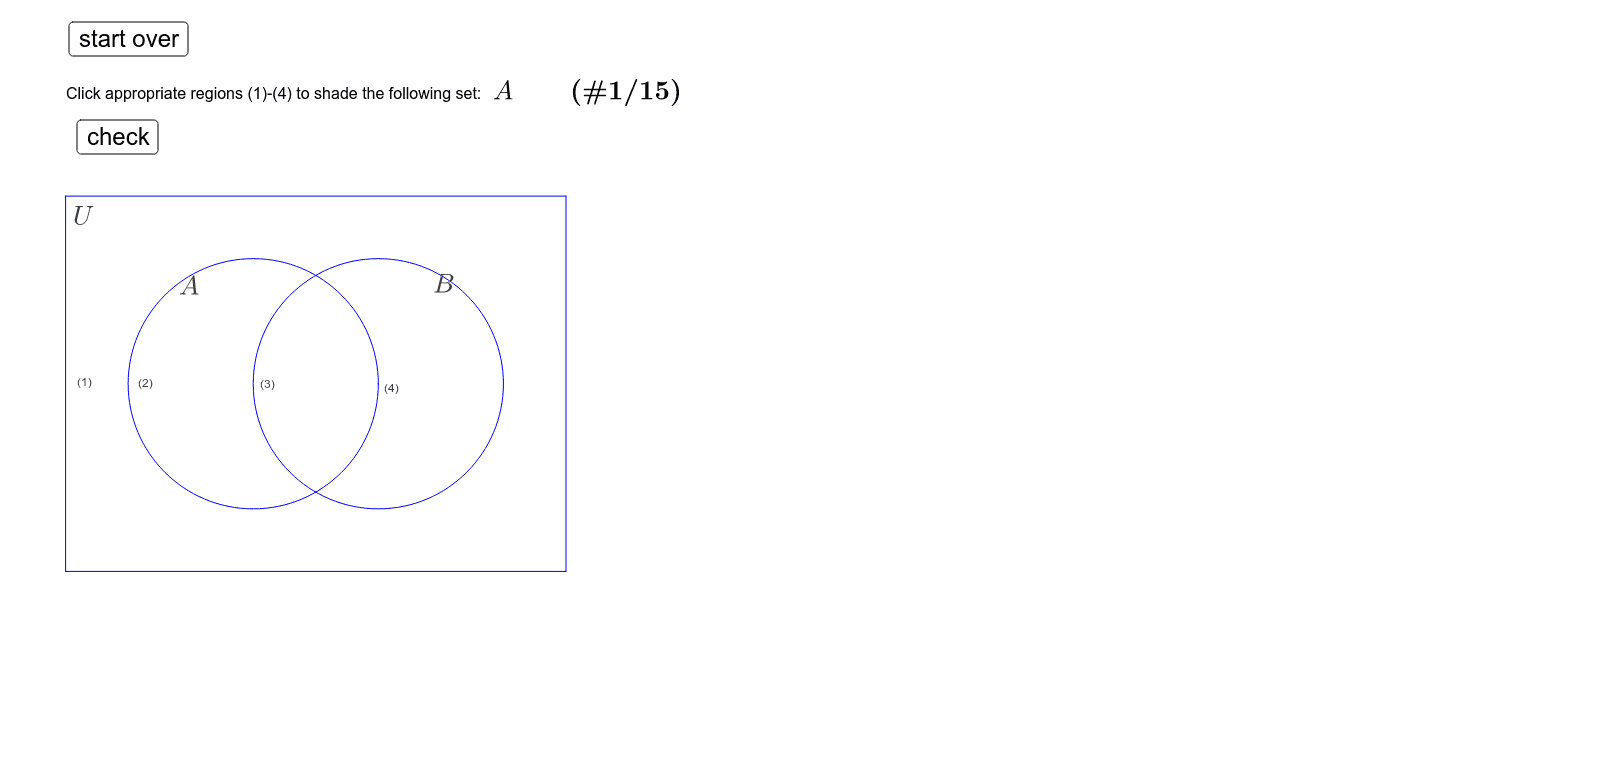
This example demonstrates and practices set operations using Venn diagrams. The core mathematical concept is set theory including intersection, union, and complement operations with visual representation. It uses GeoGebra commands: Polygon to draw the three circular regions of the Venn diagram, If for interactive judgment logic, Segment for auxiliary lines, Element to extract specific elements from sets, and Length to calculate set cardinalities. The file contains text objects (text1-text5) for displaying questions and feedback, and a startover button for repeated practice. Suitable for high school mathematics set and logic units, or as an introductory practice tool for discrete mathematics in universities.
GeoGebra Commands & Parameters
Polygon(corner) → poly1If(clr1, 0, 1) → RG1If(clr4, 0, 1) → RG4If(clr3, 0, 1) → RG3If(clr2, 0, 1) → RG2Polygon(Corner[1], Corner[2], Corner[3], Corner[4]) → poly2, e, f, g, hSegment(Element[corner, 1], Element[corner, 2]) → aSegment(Element[corner, 2], Element[corner, 3]) → bSegment(Element[corner, 3], Element[corner, 4]) → cSegment(Element[corner, 4], Element[corner, 1]) → dElement(problem, prnr, 1) → settextLength(problem) → length
AI Drawing Prompt Reference
Create a Venn diagram for set operation self-testing, featuring three overlapping circular regions representing three sets. Each circle can be filled with distinct colors to illustrate intersections, unions, and complements. Surround the diagram with a rectangular boundary defined by four corner points. Include text boxes displaying questions about set operations and corresponding feedback. Add a restart button for repeated practice. The layout should be clear and suitable for high school or introductory university discrete mathematics instruction.
The prompt above was compiled from the original drawing commands and is for reference only.