
Venn Diagram and Set Relations
Loading the math board and drawing, please wait…
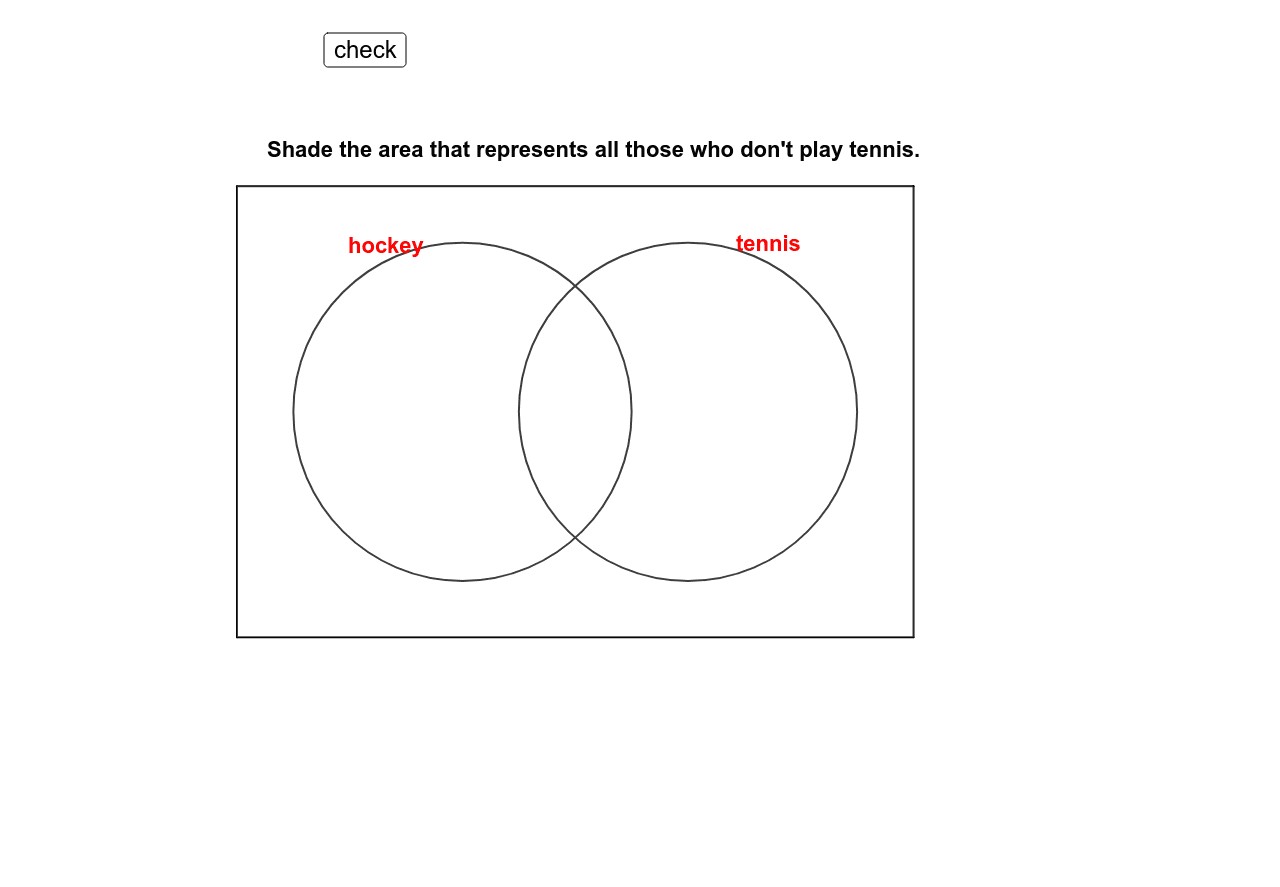
This example demonstrates Venn diagrams using GeoGebra, showing relationships between sets such as intersections and unions. Key mathematical concepts include set theory, logical operations, and graphical representation. Construction involves using commands like Polygon, Circle, If, and Mod, along with objects A, B, C, D, etc. It is suitable for middle school students to understand set concepts or as a teaching aid in mathematics.
GeoGebra Commands & Parameters
Polygon(A, D, C, B) → poly1, a, d, c, bPoint(xAxis) → EPoint(xAxis) → FCircle(E, G) → eCircle(F, H) → fIf(Mod[tagg, 2] ≟ 0, "white", "green") → colgIf(Mod[tagh, 2] ≟ 0, "white", "green") → colhIf(Mod[tagi, 2] ≟ 0, "white", "green") → coliIf(Mod[tagj, 2] ≟ 0, "white", "green") → coljMod(tagg, 2) → tagg2Mod(tagh, 2) → tagh2Mod(tagi, 2) → tagi2Mod(tagj, 2) → tagj2
AI Drawing Prompt Reference
Draw a Venn diagram with two intersecting circles to illustrate the intersection and union of sets, where the color of the circles changes based on the parity of labels, start by drawing two circles, then determine the color of the circles according to the labels, and finally highlight the intersection area of the two circles.
The prompt above was compiled from the original drawing commands and is for reference only.