
Using Rectangles to Find Bounds for the Area Under a Curve
Loading the math board and drawing, please wait…
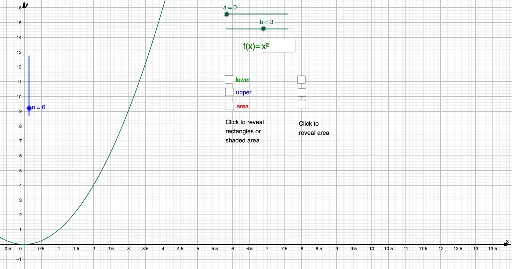
This GeoGebra example dynamically demonstrates how to approximate the area under a curve using rectangles, providing both lower and upper bounds. It visualizes the concept of Riemann sums (lower and upper sums) and the transition to the definite integral. The construction uses the LowerSum and UpperSum commands to generate rectangle approximations, the Integral command to compute the exact area, a slider n to control the number of rectangles, and an input box to change the function. Text objects display the computed sums and the exact integral for comparison. This is ideal for high school or introductory college calculus students to grasp the idea of limits and the geometric meaning of integration, and for teachers to illustrate the approximation process interactively.
GeoGebra Commands & Parameters
LaTeX(f, true, true) → text1Textfield(f) → inputBox1LowerSum(f, a, b, n) → cUpperSum(f, a, b, n) → dIntegral(f, a, b) → e