
US Healthcare Simulation (1-prop z)
Loading the math board and drawing, please wait…
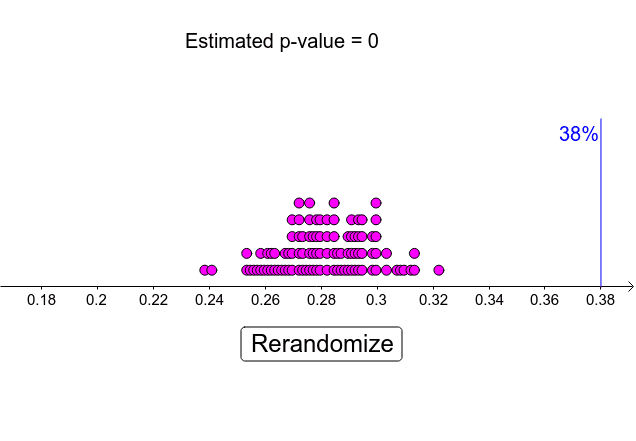
This example demonstrates the distribution of US healthcare data, visually presenting data characteristics through charts. Core math concepts include probability & statistics, data analysis, and normal distribution. Construction highlights involve commands/objects like Sequence, DotPlot, Segment, and Point in GeoGebra for data visualization. Suitable for high school students and educators for learning statistical distributions and data analysis methods.
GeoGebra Commands & Parameters
Sequence(RandomBinomial[801, 0.28] / 801, n, 1, 100) → list1DotPlot(list1, false, 0.2) → list2Segment((0.38, 0), (0.38, 2)) → fPoint(f) → A